MAKE A MEME
View Large Image

| View Original: | WeierstrassFunction.svg (795x505) | |||
| Download: | Original | Medium | Small | Thumb |
| Courtesy of: | commons.wikimedia.org | More Like This | ||
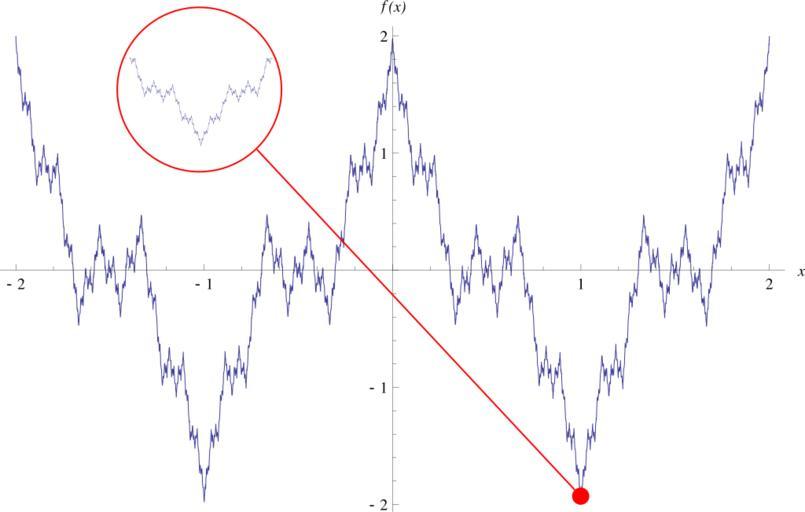
| Keywords: WeierstrassFunction.svg en Plot of the Weierstrass function A section of the plot is zoomed in on to illustrate the fractal nature of the function The plot was generated using Mathematica and exported to SVG I first made a plot of the region and then a plot of a much smaller section around the red point on the image With the use of Inkscape I was able to put the two in the same SVG file This file is an Inkscape SVG not a plain SVG Own Eeyore22 2008-10-26 http //commons wikimedia org/wiki/Image Weierstrass_function gif ValidSVG Weierstrass function | ||||