MAKE A MEME
View Large Image

| View Original: | WAIS-IV FSIQ Scores by Race and Ethnicity.png (1000x600) | |||
| Download: | Original | Medium | Small | Thumb |
| Courtesy of: | commons.wikimedia.org | More Like This | ||
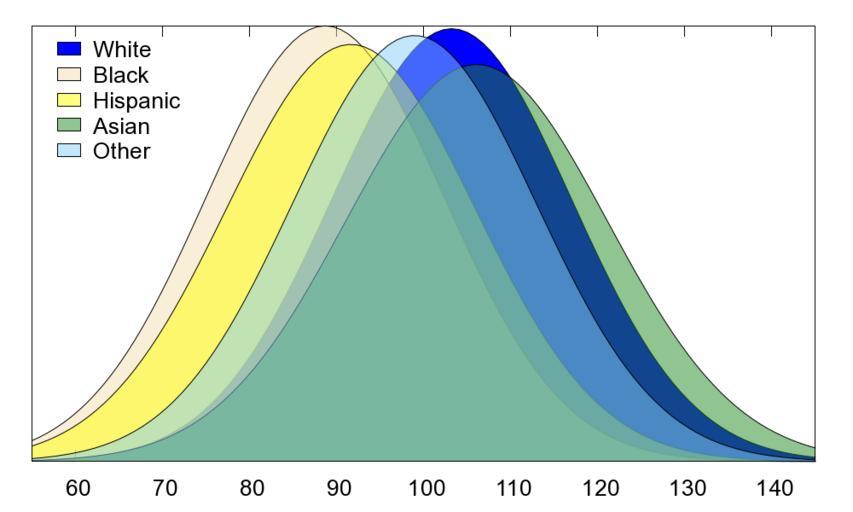
| Keywords: WAIS-IV FSIQ Scores by Race and Ethnicity.png en Approximate Wechsler Adult Intelligence Scale IV full-scale IQ score distributions for US racial and ethnic groups The data are based on samples matched to the US Census for education and region of the country within racial/ethnic group Group mean score standard deviation sample size White 103 21 13 77 1540<br> Black 88 67 13 68 260<br> Hispanic 91 63 14 29 289<br> Asian 106 07 15 01 71 <br> Other 98 93 13 99 40 Consists of Native American Indians Alaskan Natives and Pacific Islanders WAIS-IV Clinical Use and Interpretation by Weiss LG et al 2010 Table 4 3 p 118 Victor Chmara 2011-02-06 n set terminal pngcairo enhanced font arial 15 size 1000 600 set output WAIS-IV FSIQ Scores by Race and Ethnicity png set style fill transparent solid 0 5 border -1 set key inside left top vertical Left reverse enhanced autotitles nobox set key noinvert samplen 1 spacing 1 width 0 height 0 set style function filledcurves y1 0 set xrange 55 145 noreverse nowriteback unset ytics Gauss x mu sigma 1 / sigma sqrt 2 pi exp - x-mu 2 / 2 sigma 2 d1 x Gauss x 103 21 13 77 white d2 x Gauss x 88 67 13 68 black d3 x Gauss x 91 63 14 29 Hispanic d4 x Gauss x 106 07 15 01 Asian d5 x Gauss x 98 93 13 99 Other plot d1 x fs solid 1 0 lc rgb blue title White \ d2 x lc rgb F5DEB3 title Black \ d3 x lc rgb yellow title Hispanic \ d4 x lc rgb 228B22 title Asian \ d5 x lc rgb 87CEFA title Other set output Cc-zero IQ Race in the United States Demographic charts of the United States | ||||