MAKE A MEME
View Large Image

| View Original: | Voltage regulator foldback.svg (222x221) | |||
| Download: | Original | Medium | Small | Thumb |
| Courtesy of: | commons.wikimedia.org | More Like This | ||
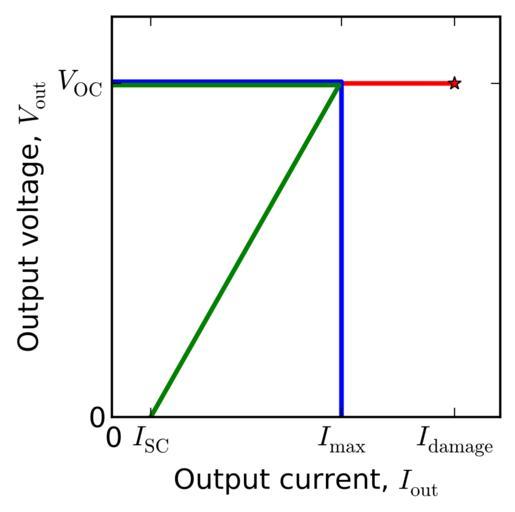
| Keywords: Voltage regulator foldback.svg en Voltage regulator V-I curves for foldback current limited and unlimited 2013-08-01 15 37 04 own Nanite Source Created with Matplotlib Requires matplotlib Due to a bug in wikipedia's SVG renderer the raw files appear with curves peeking outside of the axes Before uploading the files were touched up by releasing and re-setting the clip paths <source lang python > from pylab import figtype ' svg' saveopts 'bbox_inches' 'tight' 'transparent' True 'frameon' True seterr divide 'ignore' V_fb concatenate linspace 9 95 9 95 100 endpoint False linspace 9 95 0 101 I_fb concatenate linspace 0 0 995 100 endpoint False linspace 0 995 0 17 101 V_cl concatenate linspace 10 05 10 05 100 endpoint False linspace 10 05 0 101 I_cl concatenate linspace 0 1 005 100 endpoint False linspace 1 005 1 005 101 V_nl linspace 10 10 151 I_nl linspace 0 1 5 151 Compute powers; Assume regulator is dropping voltage from a source 20 higher than V_oc P_cl I_cl V_cl0 1 2 - V_cl P_fb I_fb V_fb0 1 2 - V_fb P_nl I_nl V_nl0 1 2 - V_nl Gcrit 0 1 Rcrit 10 Pcrit 2 Make V-I curve plot fig figure ax axes xlim 0 1 7 ylim 0 12 ax set_xlabel 'Output current I_ \\rm out ' ax set_xticks I_fb0 I_fb-1 max I_cl max I_nl ax set_xticklabels '0' ' I_ \\rm SC ' ' I_ \\rm max ' ' I_ \\rm damage ' ax set_ylabel 'Output voltage V_ \\rm out ' ax set_yticks 0 10 ax set_yticklabels '0' ' V_ \\rm OC ' ax plot I_nl V_nl 'r' linewidth 2 ax plot I_nl-1 V_nl-1 'r ' linewidth 2 ax plot I_cl V_cl 'b' linewidth 2 ax plot I_fb V_fb 'g' linewidth 2 fig set_size_inches 3 3 fig patch set_alpha 0 savefig 'foldback-vi'+figtype saveopts Make power and resistance load plot fig figure ax axes xlim 0 0 5 ylim 0 13 ax set_xlabel 'Load conductance \Omega -1 ' ax set_xticks 0 0 1 ax set_xticklabels '0' ' G_ \\rm crit ' ax set_ylabel 'Regulator heating power W ' ax set_yticks 0 round P_fb100 1 round max P_fb 1 round P_fb-1 1 round P_cl-1 1 ax set_yticklabels '0' ' P_ \\rm max FB ' ' P_ \\rm SC FB ' ' P_ \\rm SC CL ' Plot heat in regulator vs conductance ax axvline Gcrit color ' 777777' linestyle 'dashed' linewidth 0 5 ax axhline P_fb-1 color ' 777777' linestyle 'dashed' linewidth 0 5 ax axhline P_cl-1 color ' 777777' linestyle 'dashed' linewidth 0 5 ax plot I_nl/V_nl P_nl 'r' linewidth 2 ax plot I_nl/V_nl -1 P_nl-1 'r ' linewidth 2 ax plot I_cl/V_cl P_cl 'b' linewidth 2 ax plot I_fb/V_fb P_fb 'g' linewidth 2 ax text Gcrit/2 9 'OK' horizontalalignment 'center' ax text 0 3 9 'Overload' horizontalalignment 'center' fig set_size_inches 3 3 fig patch set_alpha 0 savefig 'foldback-loadcon'+figtype saveopts Make power and conductance load plot fig figure ax axes xlim 0 16 ylim 0 13 ax set_xlabel 'Load resistance \Omega ' ax set_xticks 0 5 10 15 ax set_xticklabels '0' ' G_ \\rm crit ' ax set_ylabel 'Dissipation in regulator W ' ax set_yticks 0 round P_fb100 1 round max P_fb 1 round P_fb-1 1 round P_cl-1 1 ax set_yticklabels '0' ' P_ \\rm max FB ' ' P_ \\rm SC FB ' ' P_ \\rm SC CL ' Plot heat in regulator vs resistance amfb argmax P_fb grey lines ax axvline Rcrit color ' 777777' linestyle 'dashed' linewidth 0 5 ax plot 0 V_fbamfb/I_fbamfb P_fbamfb 2 color ' 777777' linestyle 'dashed' linewidth 0 5 ax plot 0 Rcrit Pcrit Pcrit color ' 777777' linestyle 'dashed' linewidth 0 5 curves ax plot V_nl/I_nl P_nl 'r' linewidth 2 ax plot V_nl/I_nl -1 P_nl-1 'r ' linewidth 2 ax plot V_cl/I_cl P_cl 'b' linewidth 2 ax plot V_fb/I_fb P_fb 'g' linewidth 2 ax text Rcrit/2 12 'Overloaded' horizontalalignment 'center' ax text 13 12 'Normal' horizontalalignment 'center' fig set_size_inches 3 3 fig patch set_alpha 0 savefig 'foldback-loadres'+figtype saveopts </source> cc-zero Uploaded with UploadWizard Voltage regulators Device current-voltage characteristics Images with Python source code | ||||