MAKE A MEME
View Large Image

| View Original: | US Debt Trend.svg (765x990) | |||
| Download: | Original | Medium | Small | Thumb |
| Courtesy of: | commons.wikimedia.org | More Like This | ||
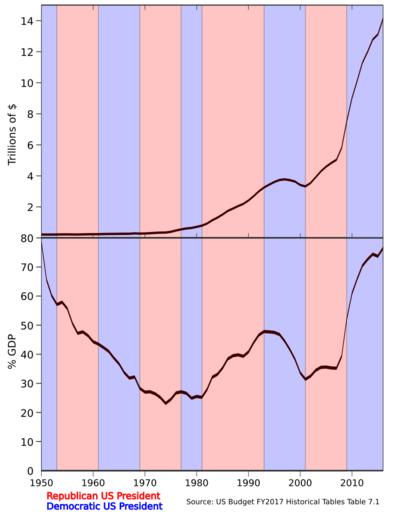
| Keywords: US Debt Trend.svg en Time series of U S public debt overlaid with partisan affiliation of the White House The upper graph shows the U S public debt in trillions of USD while the lower graph shows the U S public debt as a percentage of GDP Debt for 2016 is estimated Data is from the FY 2017 U S Budget report https //www gpo gov/fdsys/search/pagedetails action granuleId BUDGET-2017-TAB-8-1 packageId BUDGET-2017-TAB Table 7 1 2008-02-03 en wikipedia SreeBot Dejo at en wikipedia other versions File US Debt Trend-Congress svg current annually Dejo Original upload log page en wikipedia US_Debt_Trend svg Upload date User Bytes Dimensions Comment 2008-08-02 23 35 UTC LeoTrottier 17553 bytes 765×990 2008-08-02 23 35 UTC LeoTrottier 16080 bytes 0×0 version lost 2008-02-05 06 35 UTC Dejo 10435 bytes 0×0 <small>added data from 2009 budget</small> version lost 2008-02-04 01 05 UTC Dejo 10098 bytes 0×0 <small>tweaked</small> version lost 2008-02-03 23 38 UTC Dejo 10881 bytes 0×0 <small>Fixed label</small> version lost 2008-02-03 23 35 UTC Dejo 10890 bytes 0×0 <small>The data was obtained from the FY2007 US Budget report Table 7 1 http //www whitehouse gov/omb/budget/fy2007/pdf/hist pdf</small> version lost Economy of the United States Government debt Government of the United States Presidents of the United States Administration | ||||