MAKE A MEME
View Large Image

| View Original: | US Annual Family Growth in Three Eras.svg (800x600) | |||
| Download: | Original | Medium | Small | Thumb |
| Courtesy of: | commons.wikimedia.org | More Like This | ||
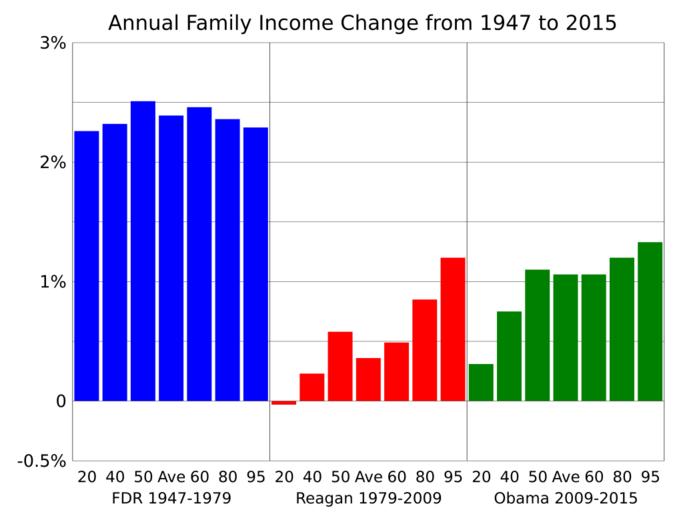
| Keywords: US Annual Family Growth in Three Eras.svg translate yes en Family income grew robustly during the FDR era from 1947 to 1979 The upper income tax bracket was 91 until 1963 when it was reduced to 70 Average family income increased about 2 39 per year with all income groups sharing equally in the increase Reagan's trickle down economy though was anemic and average family income only grew by 0 36 with all of the increase going to the rich The average income of poor families declined by an average 0 03 per year During the Obama era average family income growth has tripled to 1 06 per year but most of the increase has gone to the rich The income to be in the top 5 increased by 1 33 while the the income of the poorest 20 of families only increased by 0 31 per year All incomes are in constant 2015 dollars Data from US Census Bureau Median from https //www census gov/data/tables/time-series/demo/income-poverty/cps-finc/finc-01 html FINC-01 Mean from http //www census gov/data/tables/time-series/demo/income-poverty/historical-income-families html Table F-6 remaining data from https //www census gov/data/tables/time-series/demo/income-poverty/cps-finc/finc-06 html FINC-06 2016-09-17 own Delphi234 other versions cc-zero Income distribution in the United States | ||||