MAKE A MEME
View Large Image

| View Original: | Ukrainian parliamentary election, 2007 (Percentage).PNG (768x477) | |||
| Download: | Original | Medium | Small | Thumb |
| Courtesy of: | commons.wikimedia.org | More Like This | ||
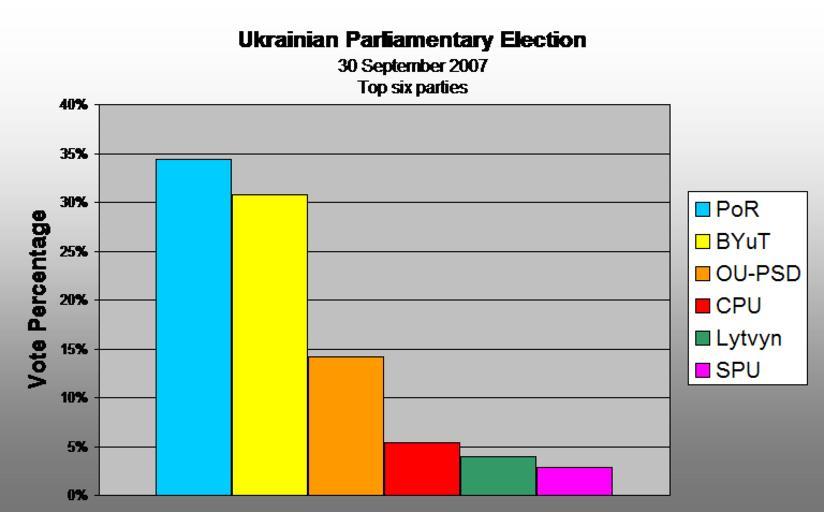
| Keywords: Ukrainian parliamentary election, 2007 (Percentage).PNG English Ukrainian parliamentary election 2007 Self-made based off map by Muumi with data from http //www cvk gov ua/vnd2007/w6p001 html Central Election Commission of Ukraine 2008-02-11 User DemocracyATwork DemocracyATwork Image Ukrainian parliamentary election 2007 Highest Vote per Region PNG - by electoral regions with shaded vote percentage Image Ukrainian parliamentary election 2007 PoR PNG - by electoral regions with shaded vote percentage per region Image Ukrainian parliamentary election 2007 BYuT PNG - by electoral regions with shaded vote percentage per region Image Ukrainian parliamentary election 2007 OU-PSD PNG - by electoral regions with shaded vote percentage per region Image Ukrainian parliamentary election 2007 CPU PNG - by electoral regions with shaded vote percentage per region Image Ukrainian parliamentary election 2007 BLP PNG - by electoral regions with shaded vote percentage per region Image Ukrainian parliamentary election 2007 SPU PNG - by electoral regions with shaded vote percentage per region Image Ukrainian parliamentary election 2007 Results PNG - by electoral regions with shaded vote percentage per region Image Ukrainian parliamentary election 2007 Vote PNG - by electoral regions with shaded vote percentage per region Image Ukrainian parliamentary election 2007 Swing PNG - by electoral regions with shaded vote percentage per region Collection wikitable - + Results of the parliamentary elections - 250px center Politcal alignment 2007 250px center Vote percenatge 2006 to 2007 Top Six parties 250px Swing 2006 to 2007 Top Six parties Regional Analysis of the parliamentary elections wikitable - 250px center Highest Vote per region wikitable - + Charts showing the top six parties support - percentage of total national vote and Electoral Region 250px Vote Percentage by Electoral Region 250px Vote Percentage by Electoral Region 250px Swing by Electoral Regions wikitable - + Maps showing the top six parties support - percentage of total national vote - 250px center Party of Regions results 34 37 250px center Bloc Yulia Tymoshenko results 30 71 250px center Our Ukraine People's Self-Defence results 14 15 - 250px center Communist Party of Ukraine results 5 39 250px center Bloc Lytvyn Party results 3 96 250px center Socialist Party of Ukraine results 2 86 wikitable - + Maps showing the top six parties support - percentage of total national vote Minimal text - 250px center Party of Regions results 34 37 250px center Bloc Yulia Tymoshenko results 30 71 250px center Our Ukraine People's Self-Defence results 14 15 - 250px center Communist Party of Ukraine results 5 39 250px center Bloc Lytvyn Party results 3 96 250px center Socialist Party of Ukraine results 2 86 wikitable - + Maps showing the top six parties support - percentage per region - 250px center Party of Regions results 34 37 250px center Bloc Yulia Tymoshenko results 30 71 250px center Our Ukraine People's Self-Defence results 14 15 - 250px center Communist Party of Ukraine results 5 39 250px center Bloc Lytvyn Party results 3 96 250px center Socialist Party of Ukraine results 2 86 <br clear all /> 2007 <ref> Uraine CEC 2007 Party of Reguions First place Party results 2007-10-01 2007-10-01 Ukrainian </ref> <ref> Uraine CEC 2007 BYuT Second place Party results 2007-10-01 2007-10-01 Ukrainian </ref> <ref> Uraine CEC 2007 OU-PSD Third place results 2007-10-01 2007-10-01 Ukrainian </ref> <ref> Uraine CEC 2007 CPU Forth place Party results 2007-10-01 2007-10-01 Ukrainian </ref> <ref> Uraine CEC 2007 Bloc Lytcyn Firth Party results 2007-10-01 2007-10-01 Ukrainian </ref> <ref> Uraine CEC SPU Sith place Party results 2007-10-01 2007-10-01 Ukrainian </ref> 2006 <ref> Uraine CEC 2006 Party of Regions First place Party results 2006-3-27 2007-3- 27 Ukrainian </ref> <ref> Uraine CEC 2006 BYuT Second place Party results 2006-3-27 2007-3- 27 Ukrainian </ref> <ref> Uraine CEC 2006 OU Third place Party results 2006-3-27 2007-3- 27 Ukrainian </ref> <ref> Uraine CEC 2006 SPU Fourth place Party results 2006-3-27 2007-3- 27 Ukrainian </ref> <ref> Uraine CEC 2006 CPU Firth place Party results 2006-3-27 2007-3- 27 Ukrainian </ref> <ref> Uraine CEC 2006 BLytvn Seventh place Party results 2006-3-27 2007-3- 27 Ukrainian </ref> A swing analysis is common in any election It shows the change in voter percentage for each party by regions from 2006 to 2007 Yulia Tymoshenko Bloc 2007 Ukrainian parliamentary election Election diagrams and charts of Ukraine Maps created by DemocracyATwork Location not applicable Apportionment bar charts | ||||