MAKE A MEME
View Large Image

| View Original: | UK tv pay vs free providers q1 2009.png (90x96) | |||
| Download: | Original | Medium | Small | Thumb |
| Courtesy of: | commons.wikimedia.org | More Like This | ||
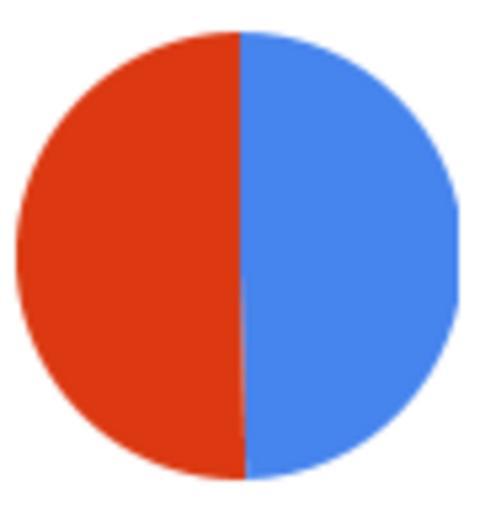
| Keywords: UK tv pay vs free providers q1 2009.png Pie chart depicting proportion of households' main TVs with subscription blue/49 5 vs free red/50 5 television providers Source is http //www ofcom org uk/research/tv/reports/dtv/dtu_2009_01/q12009 pdf Ofcom The Communications Market Digital Progress Report - Digital TV Q1 2009 Own 2009-07-05 Walt111 Replacement for file UK tv pay vs free providers q4 2008 png Pie charts Television of the United Kingdom Television viewing statistics cc-zero UK tv pay vs free providers q4 2008.png en Pie chart depicting proportion of households' main TVs with subscription blue/49 5 vs free red/50 5 television providers Source is http //www ofcom org uk/research/tv/reports/dtv/dtu_2008_04/q42008 pdf Ofcom The Communications Market Digital Progress Report - Digital TV Q4 2008 own Walt111 2009-05-10 Replacement for file Uk tv pay vs free providers q3 2008 png Pie charts Television of the United Kingdom cc-by-sa-3 0 GFDL cc-zero | ||||