MAKE A MEME
View Large Image

| View Original: | Trends_in_global_average_absolute_sea_level,_1880-2013.png (670x582) | |||
| Download: | Original | Medium | Small | Thumb |
| Courtesy of: | commons.wikimedia.org | More Like This | ||
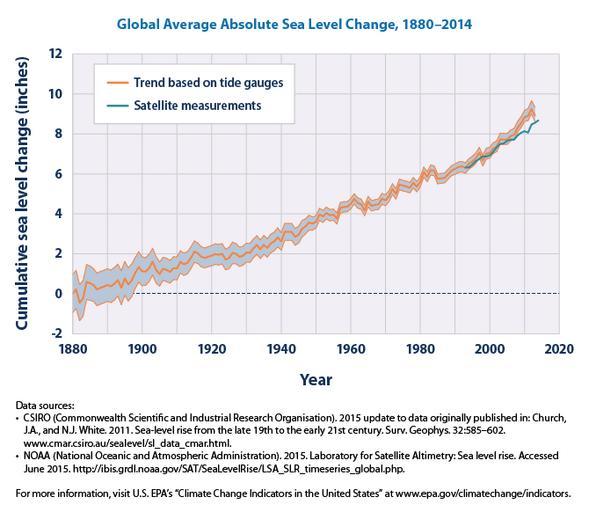
| Keywords: Trends in global average absolute sea level, 1880-2013.png sea level from 1880 to 2013 From the public domain source the US EPA 2014 This figure shows average absolute sea level change which refers to the height of the ocean surface regardless of whether nearby land is rising or falling Satellite data are based solely on measured sea level while the long-term tide gauge data include a small correction factor because the size and shape of the oceans are changing slowly over time The shaded band shows the likely range of values based on the number of measurements collected and the precision of the methods used 2014-05 http //www epa gov/climatechange/science/indicators/oceans/sea-level html US EPA other versions PD-USGov Uploaded with UploadWizard Global warming graphs Sea level statistics | ||||