MAKE A MEME
View Large Image

| View Original: | The spatial distribution of Plasmodium vivax malaria endemicity map in 2010 globally.png (1880x1330) | |||
| Download: | Original | Medium | Small | Thumb |
| Courtesy of: | commons.wikimedia.org | More Like This | ||
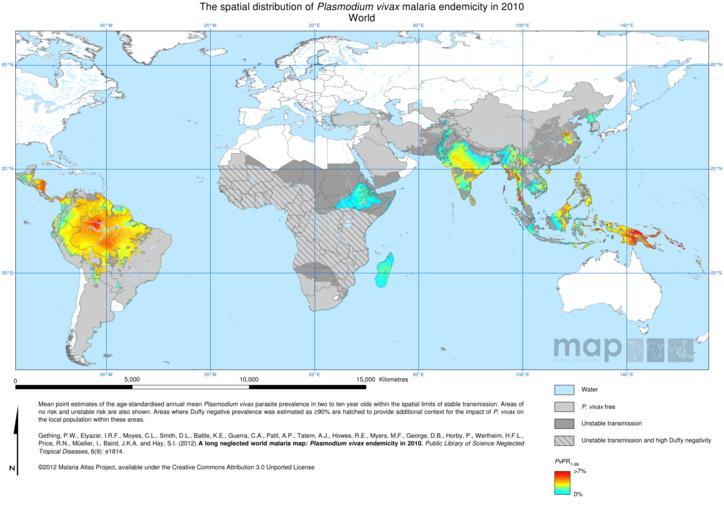
| Keywords: The spatial distribution of Plasmodium vivax malaria endemicity map in 2010 globally.png Uploaded with en wp UW marker 2013 05 09 This image was obtained from www map ox ac uk This map shows estimated levels of Plasmodium vivax malaria endemicity within the limits of stable transmission The mapped variable is the age-standardised P vivax Parasite Rate PvPR0-99 which describes the estimated proportion of the general population that are infected with P vivax at any one time averaged over the 12 months of 2010 Estimates are made based on data from parasite rate surveys which feed into a geostatistical model that produces a a range of predicted endemicities for each location a probability distribution The model also uses data from environmental covariates which help predict more accurately especially in areas far from any actual survey data The environmental covariates include rainfall temperature land cover and urban/ rural status The model incorporated data on Duffy negativity in human populations particularly in Africa and we also provide a separate map of the predicted frequency of Duffy negativity The endemicity map displayed shows the mean value for the probability distribution at each location approx 5km2 http //www plosntds org/article/info doi/10 1371/journal pntd 0001814 2012 Gething P W et al http //www plosntds org/article/info doi/10 1371/journal pntd 0001814 Gething P W et al Protista distribution maps Geostatistics Malaria maps | ||||