MAKE A MEME
View Large Image

| View Original: | Swineflu uk rate.svg (636x475) | |||
| Download: | Original | Medium | Small | Thumb |
| Courtesy of: | commons.wikimedia.org | More Like This | ||
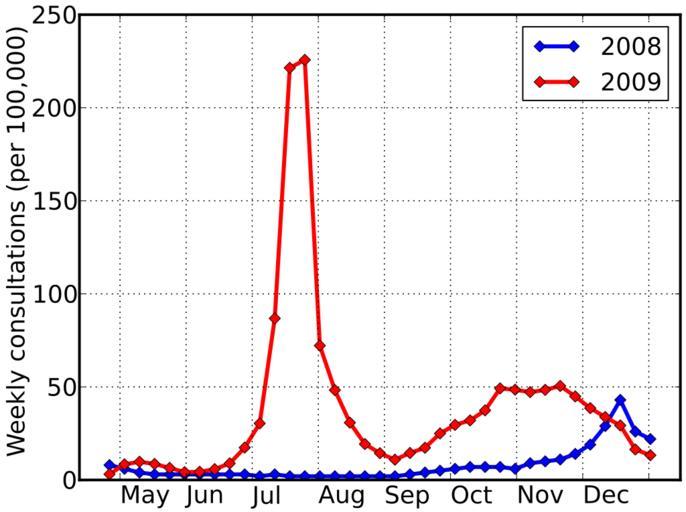
| Keywords: Swineflu uk rate.svg en Weekly consultation rate for influenza-like illness in the UK Graph is own work by uploader numerical data from documents at HPA which sourced data from QResearch Dave Farrance 2010-01-15 Source Figures for 2009 flu sourced from documents at HPA Weekly epidemiological updates archive http //www hpa org uk/webw/HPAweb HPAwebStandard/HPAweb_C/1244442494458 and figures for 2008 flu estimated from inspection of Fig 2 at web-page for HPA's Weekly pandemic flu update for 16th July 2009 http //www hpa org uk/web/HPAweb HPAwebStandard/HPAweb_C/1247728933406 This graph was created with the following Python/Matplotlib script <source lang python > /usr/bin/env python from pylab import flu08 8 6 4 3 3 3 3 3 3 3 2 3 2 2 2 2 2 2 2 2 3 4 5 6 7 7 7 6 9 10 11 14 19 29 43 26 22 flu09 3 1 8 4 9 8 8 6 6 5 4 2 4 4 5 8 8 9 17 4 30 4 86 8 221 4 225 7 72 2 48 3 30 8 19 3 14 4 10 9 14 5 17 3 25 0 29 6 32 0 37 4 49 2 48 5 47 2 48 4 50 5 44 9 38 6 33 8 29 3 16 4 13 3 rc 'axes' lw 2 0 plot range 17 17+len flu08 flu08 'bD-' lw 3 0 label '2008' plot range 17 17+len flu09 flu09 'rD-' lw 3 0 label '2009' xticks array range 0 9 4 4+17 7 'May' 'Jun' 'Jul' 'Aug' 'Sep' 'Oct' 'Nov' 'Dec' size 18 ha 'left' yticks size 18 grid lw 0 75 ylabel 'Weekly consultations per 100 000 ' size 18 rc 'legend' fontsize 18 ; legend savefig 'sf-qs svg' </source> I release the graph and its source script to the public domain -- but note that the numerical data that was used to create this graph was sourced from press release documents on the HPA website which sourced data from QResearch but I could find no statement of rights to that numerical data either in the documents or on the website Influenza Epidemics 2009 swine flu outbreak in the United Kingdom 2009 swine flu outbreak graphs Pandemic | ||||