MAKE A MEME
View Large Image

| View Original: | Student density.svg (600x480) | |||
| Download: | Original | Medium | Small | Thumb |
| Courtesy of: | commons.wikimedia.org | More Like This | ||
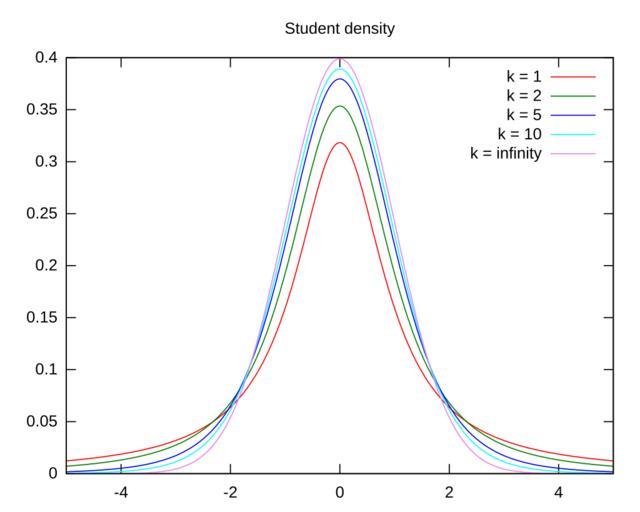
| Keywords: Student density.svg en A plot of the Student's t-distribution where k is the number of degrees of freedom Plotted with gnuplot; to reproduce do <pre> set term svg set output student density svg set samples 500 set xrange -5 5 set title Student density f x t gamma t+1 /2 / sqrt t pi gamma t/2 1 + x 2/t - t+1 /2 plot f x 1 t k 1 f x 2 t k 2 f x 5 t k 5 f x 10 t k 10 exp -x 2/2 /sqrt 2 pi t k infinity lt rgb violet </pre> Created with Gnuplot fr Un graphe de la densité de probabilité de la loi de Student avec k le nombre de degrés de libertés Tracé avec gnuplot pour reproduire faire <pre> set term svg set output student density svg set samples 500 set xrange -5 5 set title Student density f x t gamma t+1 /2 / sqrt t pi gamma t/2 1 + x 2/t - t+1 /2 plot f x 1 t k 1 f x 2 t k 2 f x 5 t k 5 f x 10 t k 10 exp -x 2/2 /sqrt 2 pi t k infinity lt rgb violet </pre> Created with Gnuplot 2014-05-19 17 19 07 own Lugian cc-zero Uploaded with UploadWizard Check categories 2015 June 18 Student's t-distribution | ||||