MAKE A MEME
View Large Image
| View Original: | Structure valeur ajoutée USA 2006.svg (323x274) | |||
| Download: | Original | Medium | Small | Thumb |
| Courtesy of: | commons.wikimedia.org | More Like This | ||
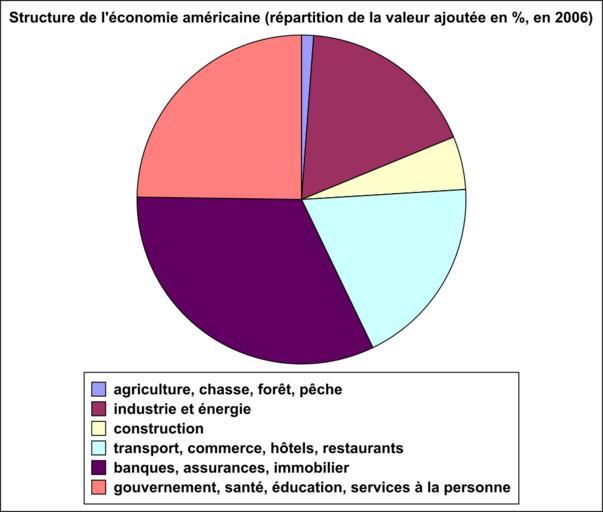
| Keywords: Structure valeur ajoutée USA 2006.svg fr Graphique représentant la répartition de la valeur ajoutée par secteur aux Etats-Unis en pourcentage du total en 2006 source http //stats oecd org/wbos/Index aspx querytype view queryname 90 Current Query United States OECD Stat Extracts Own Urban 2009-04-23 Economy of the United States | ||||