MAKE A MEME
View Large Image

| View Original: | Spectrumgstring.jpg (699x477) | |||
| Download: | Original | Medium | Small | Thumb |
| Courtesy of: | commons.wikimedia.org | More Like This | ||
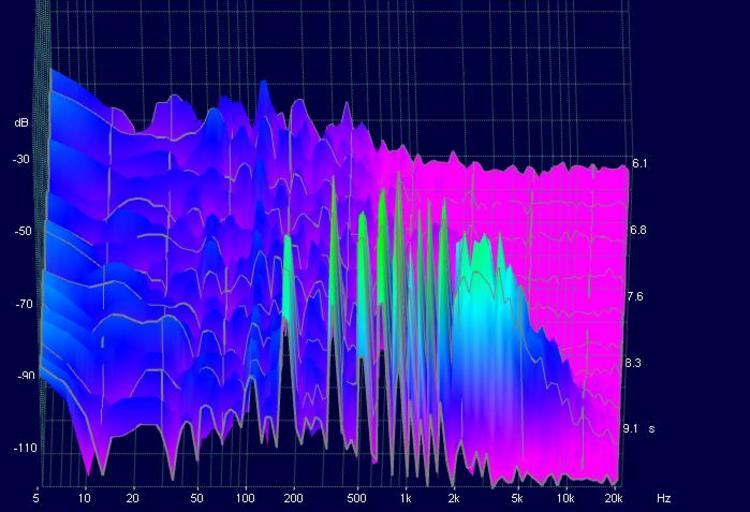
| Keywords: Spectrumgstring.jpg A 3D sound spectrum analysis of a violin's G String using the OscilloMeter program x the frequency of pitch y the volume and z time Observe the peaks at the foreground The other low points are background noise The interesting thing is that the pitch that we hear is the peak at around 200h but the other peaks are overtones that contribute to the sound greatly outnumbering the original pitch You can make out the overtone series for the note G Own 2009 Justoys Violin strings 3D Spectrogram | ||||