MAKE A MEME
View Large Image

| View Original: | Spacing Estimation plot for MSE example.png (672x672) | |||
| Download: | Original | Medium | Small | Thumb |
| Courtesy of: | commons.wikimedia.org | More Like This | ||
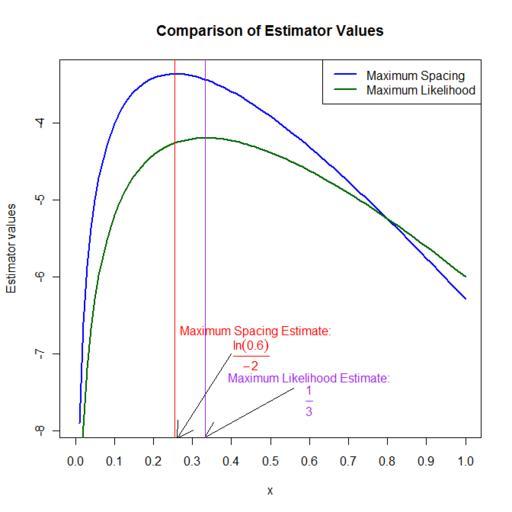
| Keywords: Spacing Estimation plot for MSE example.png Created with R Spacing Estimation plot for MSE example svg en This is a plot of the spacing estimates to help visualize the simple example given in w Maximum spacing estimation Examples It was created using the w R programming language Own Avraham 2009-07-27 <gallery>File Spacing Estimation plot for MSE example svg</gallery> Code This is the code used to generate the plot It could have been done more efficiently but this way is more self-explanatory <pre> SpacingEstimate<-function x A1<-1-exp -2 x A2<-1-exp -4 x Z<- A1 A2-A1 1-A2 return log Z Likelihood<-function x A1<-x exp -2 x A2<-x exp -4 x Z<-A1 A2 return log Z x<-seq 0 1 01 plot x SpacingEstimate x main Comparison of Estimator Values type l col blue xaxp c 0 1 10 lwd 2 ylab Estimator values points x Likelihood x col dark green type l lwd 2 arrows 4 -7 26 -8 1 arrows 56 -7 45 33 -8 09 text x 463 y -6 7 labels Maximum Spacing Estimate col red text x 45 y -7 0 labels expression frac ln 6 -2 col red text x 6 y -7 3 labels Maximum Likelihood Estimate col purple text x 6 y -7 6 labels expression frac 1 3 col purple abline v log 6 /-2 col red abline v 1/3 col purple legend topright legend c Maximum Spacing Maximum Likelihood col c blue dark green lwd 2 </pre> cc-zero Statistical inference | ||||