MAKE A MEME
View Large Image

| View Original: | Simpson's paradox continuous.svg (390x260) | |||
| Download: | Original | Medium | Small | Thumb |
| Courtesy of: | commons.wikimedia.org | More Like This | ||
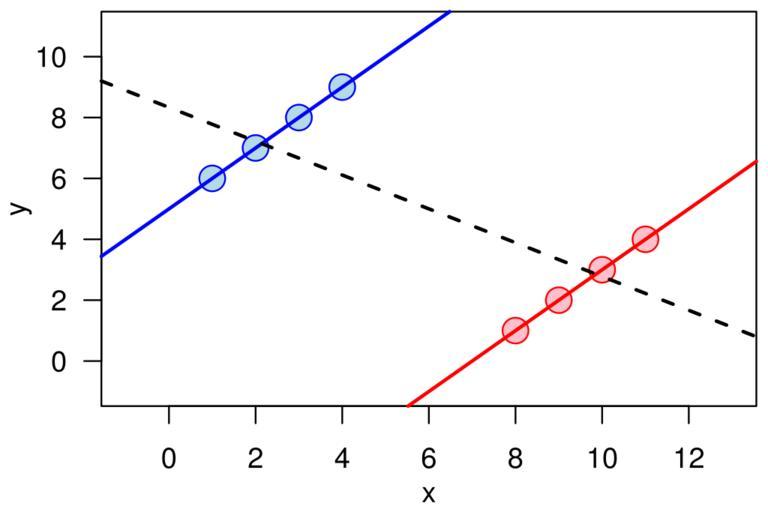
| Keywords: Simpson's paradox continuous.svg validSVG Illustration of the quantitative version of Simpson's paradox own 2007-06-14 Schutz Example of the quantitative version of w Simpson's paradox The graphic was created by User Schutz for Wikipedia on 14 June 2007 using the http //www r-project org/ R statistical project The program that generated and exported the graphic is given below; the uploaded version was generated slightly differently to workaround a bug during the PS to SVG conversion with <tt>pstoedit</tt> command The layout was slightly modified using Inkscape before upload <nowiki> x1 <- c 1 2 3 4 y1 <- x1 + 5 x2 <- x1 + 7 y2 <- x2 - 7 x <- c x1 x2 y <- c y1 y2 postscript simpson eps paper special width 4 5 height 3 par las 1 par mar c 3 3 0 5 0 5 par mgp c 2 1 0 plot x y cex 2 pch 21 col rep c blue red each 4 bg rep c lightblue pink each 4 xlim range x +c -2 2 ylim range y +c -2 2 abline lm y1 ~ x1 col blue lwd 2 abline lm y2 ~ x2 col red lwd 2 abline lm y ~ x lwd 2 lty 2 dev off </nowiki> Created with R Simpson's paradox Created with R | ||||