MAKE A MEME
View Large Image

| View Original: | Series RC capacitor voltage.svg (720x505) | |||
| Download: | Original | Medium | Small | Thumb |
| Courtesy of: | commons.wikimedia.org | More Like This | ||
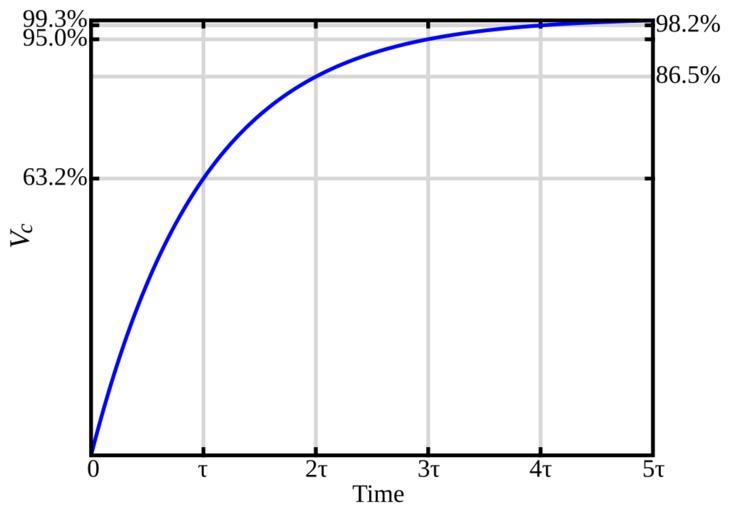
| Keywords: Series RC capacitor voltage.svg Voltage curve of a charging capacitor in a series RC circuit The vertical axis shows the voltage across the capacitor as a percentage of the applied voltage to the RC circuit τ represents the RC time constant Replaces existing PNG image Created by me using Python and matplotlib See talk for details Note If you see a checkerboard pattern behind the charts this is due to a change in the Wikipedia stylesheet to show behind transparent images I'm hopeful that it will be reverted soon so I'm going to leave them transparent 2006-03-31 own assumed Ktims derivative works Series RC capacitor voltage DE svg XY plots SVG electrical diagrams RC time constants | ||||