MAKE A MEME
View Large Image

| View Original: | Sensory neurography median nerve example.png (1275x882) | |||
| Download: | Original | Medium | Small | Thumb |
| Courtesy of: | commons.wikimedia.org | More Like This | ||
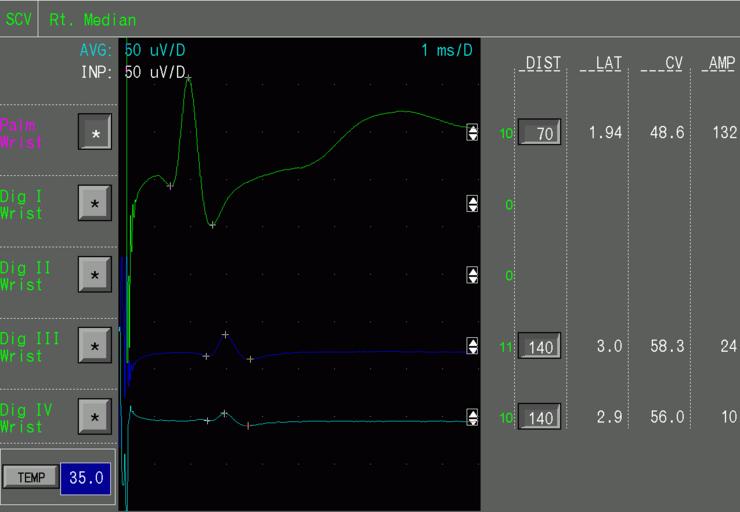
| Keywords: Sensory neurography median nerve example.png en A screenshot from the Keypoint EMG/NCV software showing the result of a sensory nerve conduction velocity study of the right median nerve from a person about 30 years The screenshot is intended to demonstrate the actual signal traces the derived markings concerning latency and amplitude the entering of distances and the computation of nerve conduction velocities Note the following Stimulation sites were the third digit Dig 3 the fourth digit Dig IV and the palm The recording site was over the median nerve at the wrist The distance from the stimulation to the recording site is indicated in the column DIST in millimeters The latency from the onset of stimulation is indicated in the LAT column in milliseconds The CV column indicates the computed conduction velocity in meters per second The AMP column indicates the amplitude of the wave in microvolts Also note that the hand temperature a critical factor in the interpretation of a study is indicated in the left lower corner in degrees Celsius own Janbrogger 2009-10-08 Check categories 2009 October 31 en wikipedia Nerve_conduction_study 3 Diagrams of the human nervous system Medical tests | ||||