MAKE A MEME
View Large Image

| View Original: | Radiative Forcing in Aviation 1992.png (3329x2023) | |||
| Download: | Original | Medium | Small | Thumb |
| Courtesy of: | commons.wikimedia.org | More Like This | ||
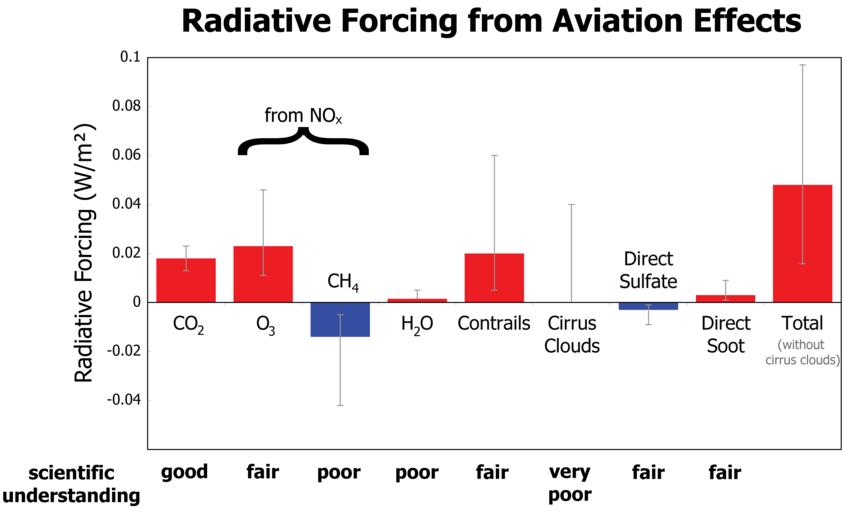
| Keywords: Radiative Forcing in Aviation 1992.png Bar charts of radiative forcing from aviation effects in 1992 Best estimates bars and high-low 67 probability intervals whiskers are given No best estimate is shown for the cirrus clouds; rather the line indicates a range of possible estimates The evaluations below the graph are relative appraisals of the level of scientific understanding associated with each component Graphique illustrant le bilan en terme de forçage radiatif de l'aviation commerciale mondiale en 1992 hors avions de tourisme et militaire Les meilleures estimations barres et des intervalles haut-bas de probabilité de 67 moustaches sont donnés On ne dispose pas encore de meilleures estimations pour les impacts liés à la formation de cirrus artificiels mais la ligne indique une fourchette d'estimations possibles Les évaluations du graphique correspondent au niveau de compréhension scientifique associé au moment de sa réalisation à chaque composant <br />Source IPCC/GIEC rapport spécial sur l'aviation et l'atmosphère non traduit en français self-made based on http //www ipcc ch/ipccreports/sres/aviation/index htm IPCC special report on Aviation and the Global Atmosphere Chapter 6 6 1 Individual Components of Radiative Forcing The http //www ipcc ch/ipccreports/sres/aviation/068 htm data is based on NASA inventories of the year 1992 that consist of calculated aircraft emissions distributed over the world's airspace by latitude longitude and altitude 2007-11-20 Thomas Splettstoesser own work graph Aviation diagrams Global warming graphs Airspace | ||||