MAKE A MEME
View Large Image

| View Original: | R-Titanic passengers.svg (180x360) | |||
| Download: | Original | Medium | Small | Thumb |
| Courtesy of: | commons.wikimedia.org | More Like This | ||
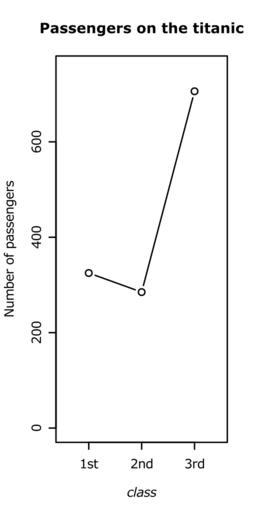
| Keywords: R-Titanic passengers.svg en Example R plot point plot with joining lines indicating number of paying passengers on the Titanic by class own HYanWong 2009-01-24 Created with R using the following commands <pre> svg file R-Titanic_passengers svg width 4 4 8 Example R plot point plot with joining lines indicating number of paying passengers on the Titanic by class plot apply Titanic 1 sum 1 3 ylim c 0 750 xlim c 0 5 3 5 xlab expression italic ShipClass ylab Number of passengers xaxt n type b axis 1 1 3 c 1st 2nd 3rd dev off </pre> Uncategorized 2015 March 23 | ||||