MAKE A MEME
View Large Image

| View Original: | R-horsekick totals-histogram+quartiles.svg (288x180) | |||
| Download: | Original | Medium | Small | Thumb |
| Courtesy of: | commons.wikimedia.org | More Like This | ||
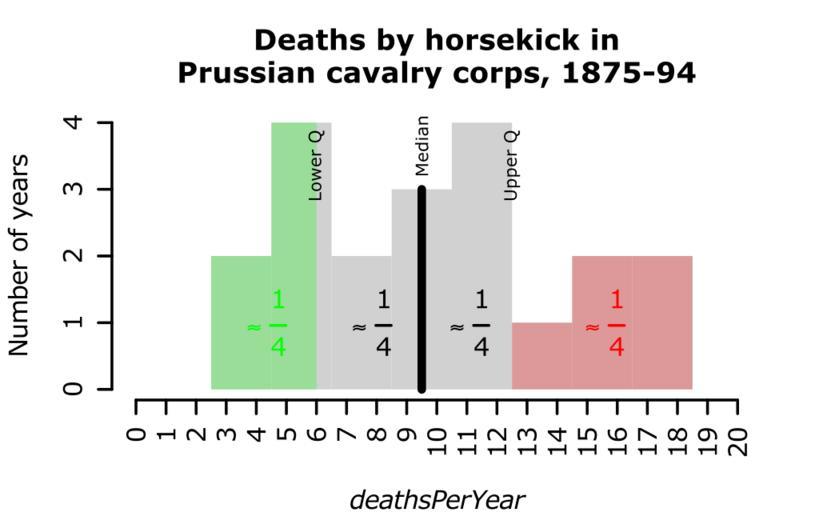
| Keywords: R-horsekick totals-histogram+quartiles.svg en Histogram example with discrete data with median line and quartiles marked by colour Data von Bortkiewicz's famous dataset of deaths by horse kick in Prussian cavalry corps Own HYanWong 2009-03-06 Created with R using the following commands <pre> svg file R-horsekick_totals-histogram+quartiles svg width 4 height 2 5 pointsize 8 Histogram example with discrete data with median line and quartiles marked by colour Data von Bortkiewicz's famous dataset of deaths by horse kick in Prussian cavalry corps library pscl par mar c 4 4 4 2 +0 1 X <- tapply prussian y prussian year sum h <- hist X breaks seq 2 5 18 5 by 2 xlim c 0 20 xlab expression italic deathsPerYear xaxt n ylab Number of years main Deaths by horsekick in\nPrussian cavalry corps 1875-94 col lightgrey border NA axis 1 0 20 las 2 lowQ <- quantile X 0 25 lowQ x <- c h breaksh breaks < lowQ lowQ lowQ y <- h countsh breaks <lowQ rect lowQ x-length lowQ x 0 lowQ x-1 lowQ y col 00FF0044 border NA text lowQ max h counts Lower Q srt 90 adj 1 1 cex 0 7 text mean range lowQ x 1 expression phantom 0 ~~ frac 1 4 phantom 0 col green upQ <- quantile X 0 75 upQ x <- c upQ h breaksh breaks > upQ upQ y <- h counts h breaks > upQ -1 rect upQ x-length upQ x 0 upQ x-1 upQ y col FF000044 border NA text upQ max h counts Upper Q srt 90 adj 1 1 cex 0 7 text mean range upQ x 1 expression phantom 0 ~~ frac 1 4 phantom 0 col red med <- quantile X 0 5 segments med 0 med h countsfindInterval med h breaks lwd 3 text med h countsfindInterval med h breaks Median srt 90 adj -0 2 cex 0 7 text mean c max lowQ x med 1 expression phantom 0 ~~ frac 1 4 phantom 0 text mean c min upQ x med 1 expression phantom 0 ~~ frac 1 4 phantom 0 dev off </pre> Histograms | ||||