MAKE A MEME
View Large Image

| View Original: | Project Gutenberg total books.svg (600x400) | |||
| Download: | Original | Medium | Small | Thumb |
| Courtesy of: | commons.wikimedia.org | More Like This | ||
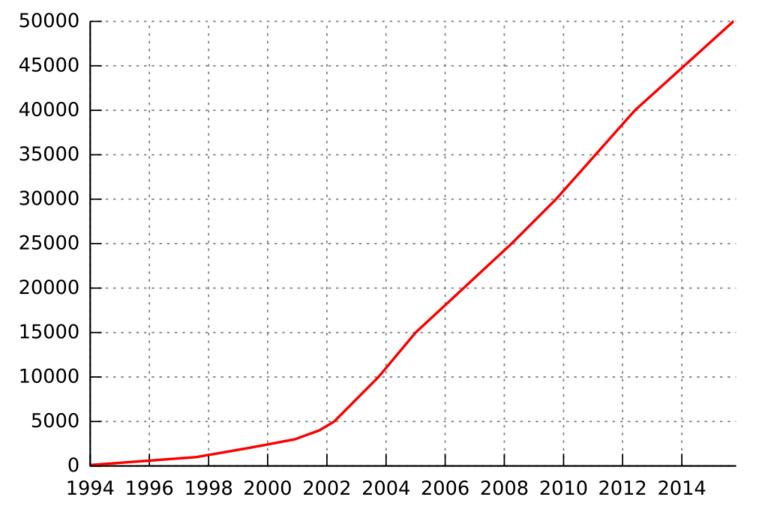
| Keywords: Project Gutenberg total books.svg en Graph showing total number of books published by Project Gutenberg over time Own work by uploader based on 'Book Milestones' statistics from http //www gutenbergnews org/statistics/ Qef 2008-07-02 other versions Alternative graph bitmap version of this but based on slightly different data Image PG_growth png other fields Gnuplot + Source code and data This graph was generated with gnuplot using the following input file <source lang gnuplot> set terminal svg font Bitstream Vera Sans 12 size 600 400 set output Project_Gutenberg_total_books svg set xdata time set timefmt Y- m set xrange 1994-01 2015-11 set format x Y set key off unset mxtics set xtics nomirror set ytics nomirror set grid set border 3 plot Project_Gutenberg_total_books data using 1 2 \ with line linetype rgbcolor red linewidth 2 </source> The data file 'Project_Gutenberg_total_books data' is derived from the 'Book Milestones' section of the http //www gutenbergnews org/statistics/ Project Gutenberg news site statistics page plus the http //www gutenbergnews org/20151003/project-gutenberg-releases-ebook-50000/ news page for the release of ebook 50000 and currently contains the following <pre> 1971-07 1 1989-08 10 1994-01 100 1997-08 1000 1999-05 2000 2000-12 3000 2001-10 4000 2002-04 5000 2003-10 10000 2005-01 15000 2008-04 25000 2009-10 30000 2012-06 40000 2015-10 50000 </pre> Qef Project Gutenberg Images with Gnuplot source code | ||||