MAKE A MEME
View Large Image
| View Original: | Prandtl meyer function.png (1212x825) | |||
| Download: | Original | Medium | Small | Thumb |
| Courtesy of: | commons.wikimedia.org | More Like This | ||
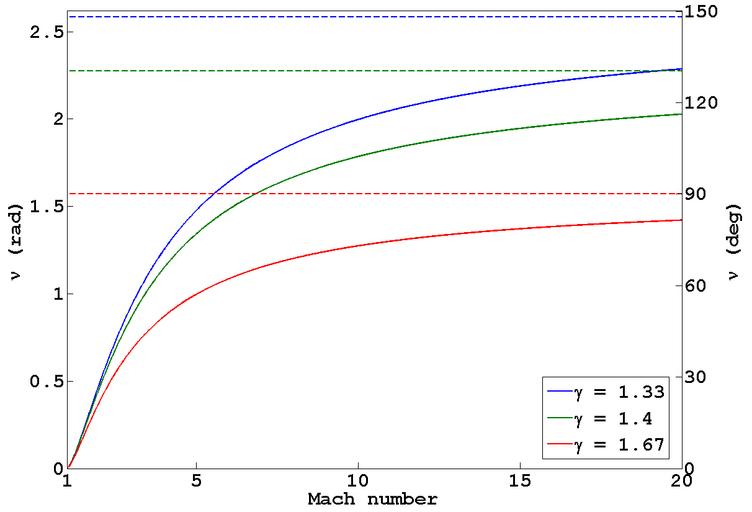
| Keywords: Prandtl meyer function.png The figure describes the variation in the Prandtl-Meyer function ν as a function of Mach number M and ratio of specific heat capacities γ The dashed lines represent the limiting value ν<sub>max</sub> as M tends to infinity self-made using Matlab created 18th Feb 2007 -Myth Talk 08 04 18 February 2007 UTC One is free to use this image No tags attached Mythealias Original upload log en wikipedia Prandtl+meyer+function png wikitable - 2007-02-18 08 04 1212×825× 33150 bytes Mythealias The figure describes the variation in the Prandtl-Meyer function ν as a function of Mach number M and ratio of specific heat capacities γ self-made using Matlab created 18th Feb 2007 A Compressible flow | ||||