MAKE A MEME
View Large Image

| View Original: | Population of Taiwan since 1978.svg (800x500) | |||
| Download: | Original | Medium | Small | Thumb |
| Courtesy of: | commons.wikimedia.org | More Like This | ||
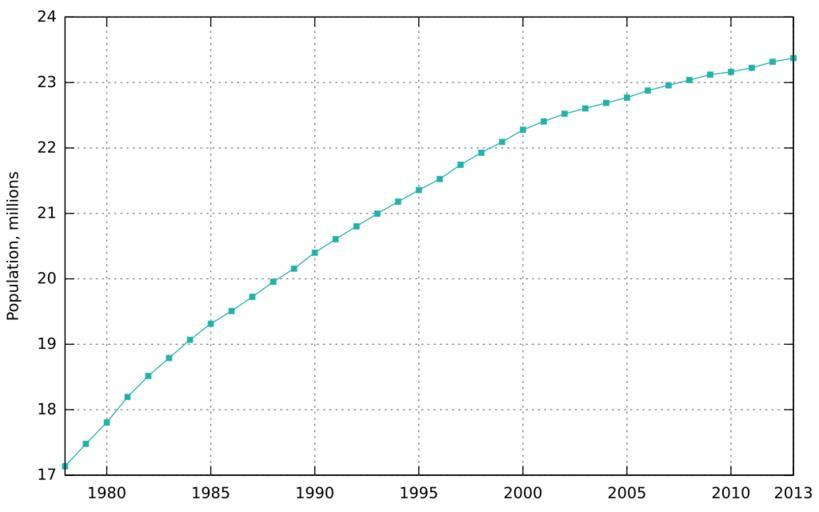
| Keywords: Population of Taiwan since 1978.svg en Taiwan's population since 1978 Own work by uploader SVG manually edited to support other languages Gnuplot Demmo 2015-09-15 Population of Taiwan since 1978 ar png Sources http //eng stat gov tw National Statistics Republic of China Taiwan Category Population and Housing http //eng stat gov tw/lp asp ctNode 2265 CtUnit 1072 BaseDSD 36 Yearly staistics Table 02-01 http //eng stat gov tw/public/data/dgbas03/bs2/yearbook_eng/y008 pdf end of year data Gnuplot gnuplot 4 6 patchlevel 4 <source lang gnuplot > set term svg size 800 500 dynamic font sans-serif set autoscale xfix set grid set style data linespoints set pointsize 0 6 unset key set ylabel Population millions set xtics add 2013 Added for clarity may be omitted if necessary plot population txt using 1 2/1000000 linetype rgb 20B2AA pt 5 </source> Data file population txt <pre> 1978 17135714 8956557 8179157 1 92 109 5 4 99 476 1 19 43 1979 17479314 9126925 8352389 2 01 109 3 4 86 485 5 19 68 1980 17805067 9288199 8516868 1 86 109 1 4 76 494 6 18 62 1981 18193955 9479508 8714447 1 84 108 8 4 66 502 9 18 13 1982 18515754 9636285 8879469 1 77 108 5 4 58 511 8 17 31 1983 18790538 9769572 9020966 1 48 108 3 4 52 519 4 15 68 1984 19069194 9904853 9164341 1 48 108 1 4 48 527 1 14 85 1985 19313825 10023344 9290481 1 28 107 9 4 42 533 8 13 23 1986 19509082 10114710 9394372 1 01 107 7 4 34 539 2 11 03 1987 19725010 10217434 9507576 1 11 107 5 4 24 545 2 11 10 1988 19954397 10328081 9626316 1 16 107 3 4 14 551 5 12 09 1989 20156587 10424102 9732485 1 01 107 1 4 06 557 1 10 57 1990 20401305 10540635 9860670 1 21 106 9 4 00 563 9 11 34 1991 20605831 10640276 9965555 1 00 106 8 3 94 569 5 10 52 1992 20802622 10734609 10068013 0 96 106 6 3 88 575 0 10 20 1993 20995416 10824161 10171255 0 93 106 4 3 82 580 3 10 27 1994 21177874 10907032 10270842 0 87 106 2 3 75 585 3 9 91 1995 21357431 10990657 10366774 0 85 106 0 3 67 590 3 9 90 1996 21525433 11065798 10459635 0 79 105 8 3 57 594 9 9 47 1997 21742815 11163764 10579051 1 01 105 5 3 50 600 8 9 48 1998 21928591 11243408 10685183 0 85 105 2 3 44 606 0 6 79 1999 22092387 11312728 10779659 0 75 105 0 3 38 610 5 7 16 2000 22276672 11392050 10884622 0 83 104 7 3 33 615 6 8 08 2001 22405568 11441651 10963917 0 58 104 4 3 29 619 1 5 94 2002 22520776 11485409 11035367 0 51 104 1 3 25 622 3 5 29 2003 22604550 11515062 11089488 0 37 103 8 3 21 624 6 4 27 2004 22689122 11541585 11147537 0 37 103 5 3 16 627 0 3 59 2005 22770383 11562440 11207943 0 36 103 2 3 12 629 2 2 92 2006 22876527 11591707 11284820 0 47 102 7 3 09 632 2 3 01 2007 22958360 11608767 11349593 0 36 102 3 3 06 634 4 2 76 2008 23037031 11626351 11410680 0 34 101 9 3 01 636 6 2 40 2009 23119772 11636734 11483038 0 36 101 3 2 96 638 8 2 07 2010 23162123 11635225 11526898 0 18 100 9 2 92 640 0 0 91 2011 23224912 11645674 11579238 0 27 100 6 2 88 641 7 1 88 2012 23315822 11673319 11642503 0 39 100 3 2 85 644 2 3 23 2013 23373517 11684674 11688843 0 25 100 0 2 82 645 8 1 85 </pre> Temporal population graphs Taiwan Demographics of Taiwan | ||||