MAKE A MEME
View Large Image

| View Original: | Population-since-10000BC-.jpg (645x438) | |||
| Download: | Original | Medium | Small | Thumb |
| Courtesy of: | commons.wikimedia.org | More Like This | ||
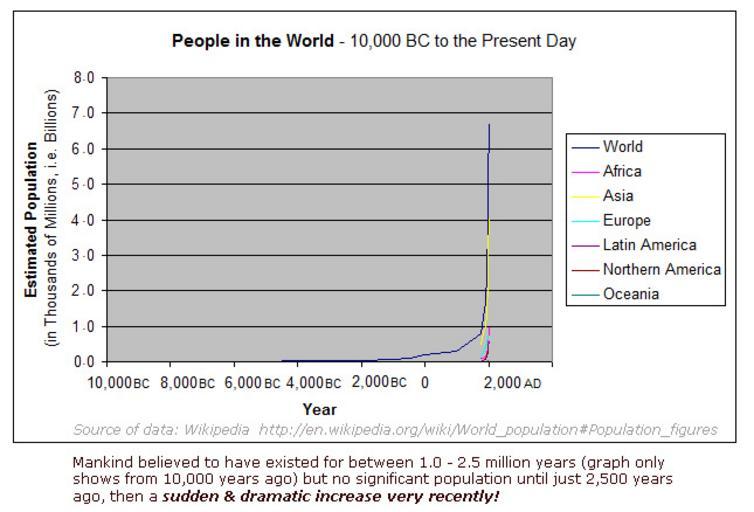
| Keywords: Population-since-10000BC-.jpg Note a Minimal population for over 1 million years of human history only last 10 000 years shown on graph b Steady growth began around 500BC c Growth accelerated noticeably from around 1000AD onwards d yet faster growth from around 1800AD e Dramatic growth since 1950 to the present day with even more forecast Own work - chart developed based on data found on http //en wikipedia org/wiki/World_population Population_figures BS 2009-01-24 Temporal population graphs | ||||