MAKE A MEME
View Large Image

| View Original: | Population Overath.svg (600x480) | |||
| Download: | Original | Medium | Small | Thumb |
| Courtesy of: | commons.wikimedia.org | More Like This | ||
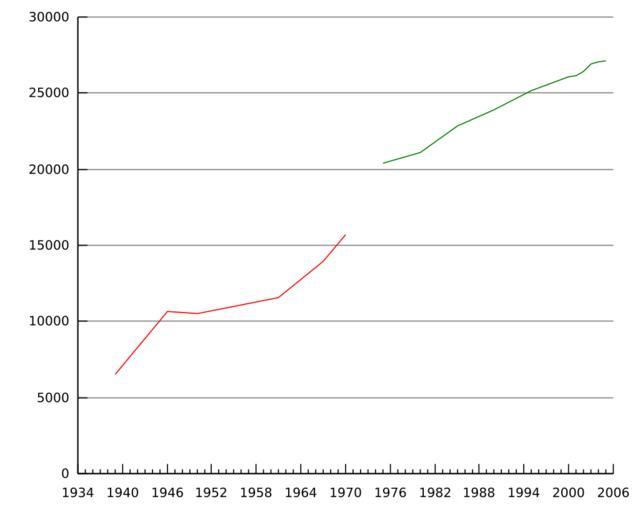
| Keywords: Population Overath.svg Population of Overath Germany Red Old community boundaries until 1975 Green New boundaries from 1975 Bevölkerung von Overath Rot Alte Gemeindegrenzen bis 1975 Grün Neue Grenzen ab 1975 own 2007-04-17 Peter Schlömer Dapete Dapete Created with gnuplot using the following commands <pre> set terminal svg enhanced fname Bitstream Vera Sans set output 'Population Overath svg' set xdata time set timefmt x Y set format x Y set xrange 2006 noreverse nowriteback set xtics nomirror set yrange 0 noreverse nowriteback set ytics nomirror set grid ytics set border 3 plot 'bev dat' using 1 2 title with lines 'bev dat' using 1 3 title with lines quit </pre> bev dat <pre> 1939 6511 1946 10620 1950 10534 1961 11544 1967 13914 1970 15694 1975 20376 1980 21095 1985 22838 1990 23902 1995 25192 2000 26059 2001 26115 2002 26410 2003 26917 2004 27022 2005 27105 </pre> Temporal population graphs of North Rhine-Westphalia Overath Overath Files by User Dapete Images with Gnuplot source code | ||||