MAKE A MEME
View Large Image

| View Original: | Plot arctic sea ice volume.svg (688x515) | |||
| Download: | Original | Medium | Small | Thumb |
| Courtesy of: | commons.wikimedia.org | More Like This | ||
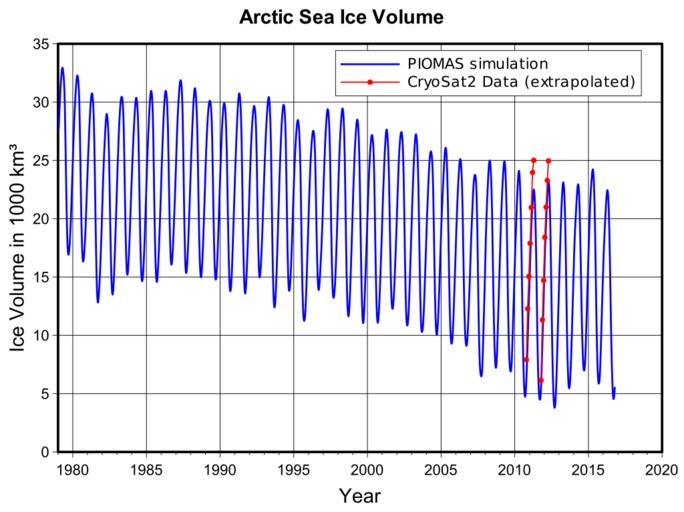
| Keywords: Plot arctic sea ice volume.svg sea ice volume between 1979 and now Blue curve are data as determined by the numerical model PIOMAS An error margin of +- 1 35 10³ km³ is given for october single values minima as orientation Red dots are data from an analysis of CryoSat 2 radar freeboard measurements Their single point uncertainty is in the range of +- 900 km³ Data have been digitized from plot Source see below As the base region of Laxon et al's plot data is smaller than the base region of the PIOMAS simulation the former have been extrapolated The PIOMAS-volume data for the CryoSat reference area have been extracted from published thickness fields So the volume ratio between the CryoSat2 and PIOMAS representations on this smaller domain is known Assuming it beeing valid on the whole PIOMAS domain CryoSat2 volume data for the larger domain have been calculated by multiplying whole domain PIOMAS volume values with said ratio A certain additional uncertainty is introduced by this assumption NOTE CryoSat 2 data points cover october to april so their lowest point does not reflect the volume minimum which happens in september de Zeitverlauf der Schätzung des Volumens des arktischen Meereseises zwischen 1979 und 2010 Die blaue Kurve wurde durch das numerische Modell PIOMAS berechnet Als Fehler für Einzelwerte wird für Oktoberwerte Minima +- 1 35 10³ km³ als Orientierung angegeben Die roten Punkte stammen aus der Analyse von CryoSat-2 - Radar-Freibordmessungen Die Werte wurden aus einer Grafik durch Digitalisierung gewonnen Quelle Laxon et al siehe unten Ihre Einzelwert-Unsicherheit liegt im Bereich von +- 900 km³ Da das Bezugsgebiet der Plotdaten kleiner ist als das der PIOMAS-Rechnungen wurden erstere extrapoliert Das PIOMAS-Volumen auf der CrySat-Referenzfläche wurde aus den veröffentlichten PIOMAS-Eisdickendaten gewonnen Dort ist also das Volumenverhältnis zwischen dem CryoSat2- und PIOMAS-Modell bekannt Unter der Annahme dass es auf der gesamten PIOMAS-Referenzfläche gilt wurden die CryoSat2-Daten aus den PIOMAS-Volumendaten durch Multiplikation mit diesem Verhältniswert extrapoliert Durch diese Annahme ist eine gewisse zusätzliche Unsicherheit eingeführt worden BEACHTE Die CryoSat 2 - Werte laufen von Oktober bis April; deshalb stellt ihr niedrigster Wert nicht das Volumenminimum dar welches im September liegt own based on published data of Polar Science Center University of Washington http //psc apl washington edu/wordpress/research/projects/arctic-sea-ice-volume-anomaly/ and Laxon et al CryoSat-2 estimates of Arctic sea ice thickness and volume GRL 40 doi 10 1002/grl 50193 Digitization of data has been done by Wipneus on https //forum arctic-sea-ice net/index php topic 8 msg825 msg825 Dominiklenne 2013-03-03 Statistics for Arctic sea ice melting | ||||