MAKE A MEME
View Large Image

| View Original: | PlanoReal.svg (1024x768) | |||
| Download: | Original | Medium | Small | Thumb |
| Courtesy of: | commons.wikimedia.org | More Like This | ||
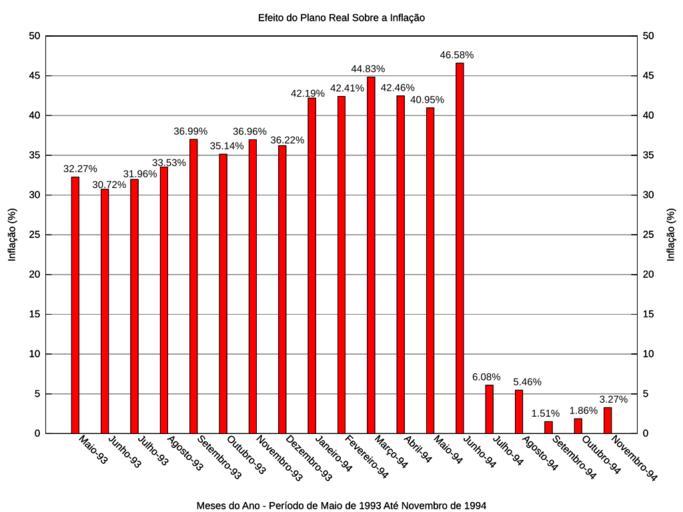
| Keywords: PlanoReal.svg en Plano Real's Effect on Inflation During the Period of May 1993 Until November 1994 Pt Efeito do Plano Real Sobre a Inflação no Período de Maio de 1993 até Novembro de 1994 own MyNameIsBIFF 2010-09-30 <pre> Dados retirados do artigo Plano Real da Wikipédia em português Data taken from the Portuguese Wikipedia's article Plano Real Dados/Data Ordem Inflação Mês-Ano Labels Order Inflation Month-Year Rótulos 1 32 27 Maio-93 32 27 2 30 72 Junho-93 30 72 3 31 96 Julho-93 31 96 4 33 53 Agosto-93 33 53 5 36 99 Setembro-93 36 99 6 35 14 Outubro-93 35 14 7 36 96 Novembro-93 36 96 8 36 22 Dezembro-93 36 22 9 42 19 Janeiro-94 42 19 10 42 41 Fevereiro-94 42 41 11 44 83 Março-94 44 83 12 42 46 Abril-94 42 46 13 40 95 Maio-94 40 95 14 46 58 Junho-94 46 58 15 6 08 Julho-94 6 08 16 5 46 Agosto-94 5 46 17 1 51 Setembro-94 1 51 18 1 86 Outubro-94 1 86 19 3 27 Novembro-94 3 27 </pre> <pre> Commandos do gnuplot para gerar o gráfico acima Gnuplot commands to create the chart reset unset key set xlabel Meses do Ano - Período de Maio de 1993 Até Novembro de 1994 set ylabel Inflação set y2label Inflação set title Efeito do Plano Real Sobre a Inflação set yrange 0 50 set y2range 0 50 set xtics border in scale 1 0 5 nomirror rotate by -45 offset character 0 0 0 set ytics 5 set y2tics 5 set grid y set style fill solid border -1 set style histogram rowstacked set style data histograms set xtics border in scale 1 0 5 nomirror rotate by -45 offset character 0 0 0 set boxwidth 0 25 set terminal svg size 1024 768 set output PlanoReal svg plot dataset using 2 xtic 3 with histogram 1 replot dataset using 1-1 1 2+1 4 with labels </pre> Inflation graphs of Brazil Plano Real Economic history of Brazil Gnuplot diagrams Diagrams in Portuguese | ||||