MAKE A MEME
View Large Image

| View Original: | Output vs input electrons.png (1000x559) | |||
| Download: | Original | Medium | Small | Thumb |
| Courtesy of: | commons.wikimedia.org | More Like This | ||
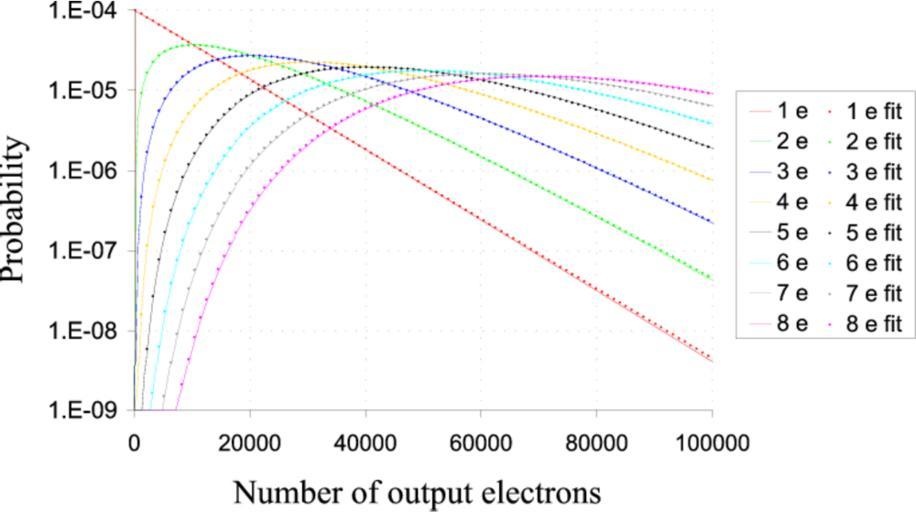
| Keywords: Output vs input electrons.png There is a dispersion variation in the number of electrons output by the multiplication register for a given fixed number of input electrons shown in the legend on the right The probability distribution for the number of output electrons calculated for one model of a multiplication register is plotted with the number of output electrons on the horizontal axis Also shown as individual points are results from the empirical fit equation shown on the en EMCCD page Graph by Bob Tubbs taken from http //www mrao cam ac uk/telescopes/coast/theses/rnt/node72 html -- see this page for further details en wikipedia 2005-03-15 Rnt20 wikipedia en Rnt20 original upload log page en wikipedia Output_vs_input_electrons png 2005-06-09 10 24 Rnt20 1000×559×8 176723 bytes <nowiki>There is a dispersion variation in the number of electrons output by the multiplication register for a given fixed number of input electrons shown in the legend on the right The probability distribution for the number of output electrons is plotted</nowiki> 2005-03-15 15 44 Rnt20 1000×516×8 163832 bytes <nowiki>There is a dispersion variation in the number of electrons output by the multiplication register for a given fixed number of input electrons The probability distribution for the number of output electrons is plotted against the number of input electr</nowiki> Charge-coupled devices | ||||