MAKE A MEME
View Large Image

| View Original: | Okuns law with confidence bands.svg (299x197) | |||
| Download: | Original | Medium | Small | Thumb |
| Courtesy of: | commons.wikimedia.org | More Like This | ||
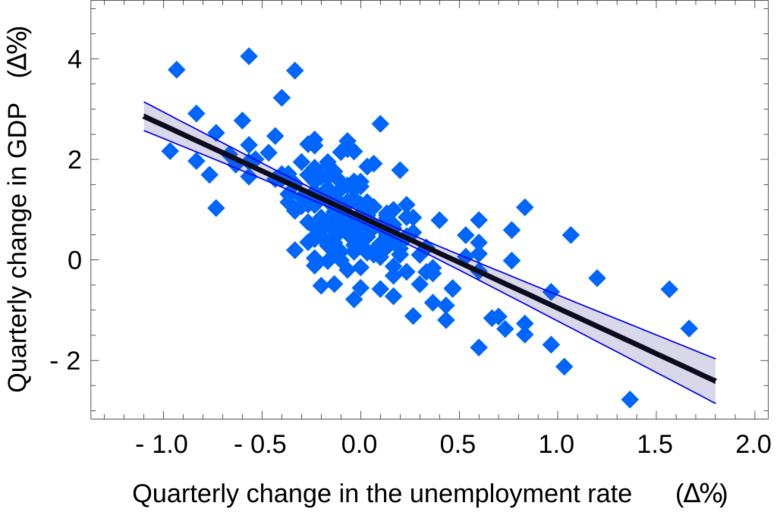
| Keywords: Okuns law with confidence bands.svg en Follow-up for the File Okuns_law_quarterly_differences svg file additionally showing the confidence bands for the regression own Stpasha Okuns_law_quarterly_differences svg Source code Mathematica Refer to the File Okuns_law_quarterly_differences svg to see the data set used <nowiki> n Lengthunempch; sol FindFitdata \Alpha + \Beta x \Alpha \Beta x ts QuantileStudentTDistributionn - 2 0 975; \Alphah \Alpha / sol; \Betah \Beta / sol; xm Meanunempch; sx2 Mean unempch - xm 2; s\Epsilon2 1/ n - 2 Total gdpch - \Alphah - \Betah unempch 2; s\Beta Sqrt1/n s\Epsilon2/sx2; s\Alpha s\Beta Sqrtsx2 + xm 2; sp Sqrt1/n s\Epsilon2 1 + x - xm 2/sx2 ; Show ListPlot -10 0 -10 0 data PlotMarkers-> Automatic Small PlotStyle->Hue0 6 Plot \Alphah + \Betah x x -1 1 1 8 PlotStyle-> GrayLevel0 Thick Plot \Alphah + \Betah x - ts sp \Alphah + \Betah x + ts sp x -1 1 1 8 Filling -> 1 -> 2 PlotStyle -> Blue Blue PlotRange -> -1 3 2 -3 5 Axes -> False Frame -> True FrameLabel -> Quarterly change in the unemployment rate \CapitalDelta Quarterly change in GDP \CapitalDelta FrameStyle -> DirectiveFontFamily -> Arial </nowiki> Regression analysis Okun's law charts | ||||