MAKE A MEME
View Large Image

| View Original: | Meissel–Mertens constant definition.svg (244x153) | |||
| Download: | Original | Medium | Small | Thumb |
| Courtesy of: | commons.wikimedia.org | More Like This | ||
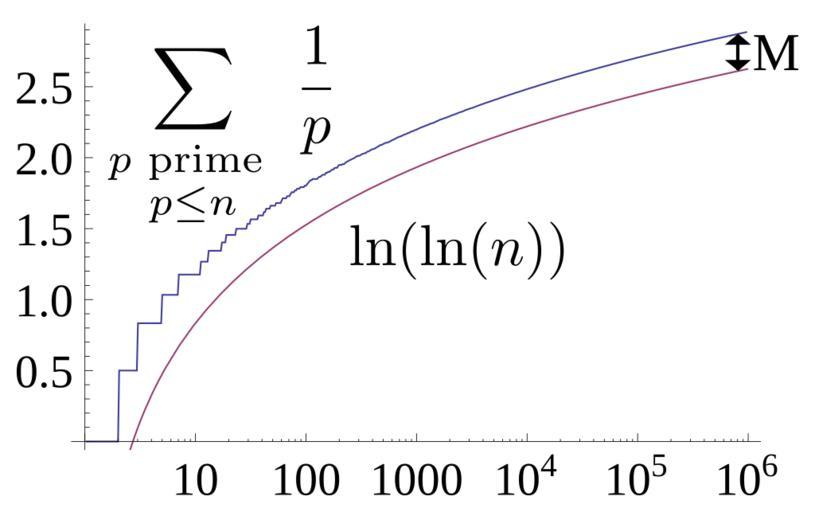
| Keywords: Meissel–Mertens constant definition.svg en A plot showing the definition of the Meissel “Mertens constant as the difference in the limit between the sum of the reciprocals of primes p < n and ln ln n The x axis is <math>n</math> and is logarithmic labelled in evenly spaced powers of 10 going up to 10<sup>6</sup> Source used to generate this chart is shown below own User Dcoetzee 2013-03-21 Prime numbers Cc-zero Source All source released under CC0 waiver Mathematica source to generate graph which was then saved as SVG from Mathematica <pre> primerecip TableN1/Primen n 1 10000000 ; gx_ ApplyPlus Takeprimerecip PrimePix; base NE Log10 6/600 ; t Table base x gbase x x 1 FloorLogbase 10 6 - 1 ; ShowListLogLinearPlott Joined -> True LogLinearPlotLogLogx x 1 10 6 PlotStyle -> ColorData1 2 LabelStyle -> FontSize -> 14 </pre> LaTeX source for labels <pre> \sum_ \scriptstyle p\scriptsize\textrm prime \atop \scriptstyle p\le n \frac1p \ln \ln n </pre> These were converted to SVG with http //www tlhiv org/ltxpreview/ and then the graph was embedded into the resulting document in Inkscape Axis fonts were also converted to Liberation Serif and arrow was added in Inkscape | ||||