MAKE A MEME
View Large Image

| View Original: | Lens and wavefronts.gif (183x356) | |||
| Download: | Original | Medium | Small | Thumb |
| Courtesy of: | commons.wikimedia.org | More Like This | ||
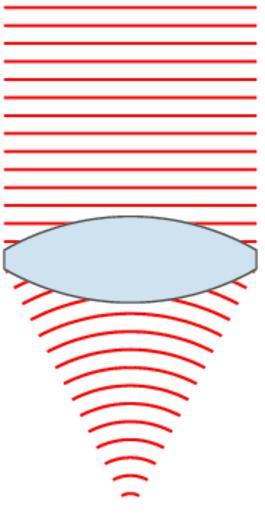
| Keywords: Lens and wavefronts.gif Illustration of wavefronts after passing through a lens Interestingly to produce a point source reverse the direction of the waves with the focus point acting as a point source self-made with MATLAB 00 49 24 November 2007 UTC Oleg Alexandrov 100px Created with MATLAB MATLAB source code <source lang matlab > Illustration of planar wavefronts going through a lens and getting focused into a converging spherical wave function main lens index n 1 5; number of points used for plotting N 100; radii of lens surfaces R1 0 5; R2 1 5; centers of circles y coord is 0 O1 -2 9; O2 -O1; focal length f n-1 1/R1+1/R2 ; f 1/f; theta0 determines the width of the lens theta0 pi/6; Theta linspace -theta0 theta0 N ; right face of the lens L1x R1 cos Theta +O1; L1y R1 sin Theta ; left size of the lens L2x -R2 cos Theta +O2; L2y R2 sin Theta ; flat top part Topx L1x N L2x N ; Topy L1y N L2y N ; flat bottom part Botx L1x 1 L2x 1 ; Boty L1y 1 L2y 1 ; the lens Lensx L1x rv_vec Topx rv_vec L2x Botx; Lensy L1y rv_vec Topy rv_vec L2y Boty; Parameters for graphing Lens_color 204 226 239/256; Lens_border 0 3 1 1 1; lbw 1 3; lens border width wavefr_color 1 0 0; wavefr_bdw 2; spacing between wavefronts both plane and spherical ones spacing 0 25; 2 H is the height of the plane wavefronts H L1y N ; theta2 slope of the line going from the upper-right end of the lens to the focus point theta2 atan L1y N / f-L1x N ; Shape of the spherical wavefronts Theta linspace -theta2 theta2 N ; X -cos Theta ; Y sin Theta ; S -f; start ploting waves from here to the right number of frames in the movie num_frames 10; Shifts linspace 0 spacing num_frames+1 ; start at S+shift plot the wavefronts for frame_no 1 num_frames shift Shifts frame_no ; s S+shift; plotting window figure 1 ; clf; hold on; axis equal; axis off; plot the plane wavefronts while s < 0 plot s s -H H 'color' wavefr_color 'linewidth' wavefr_bdw ; s s + spacing; end plot the spherical wavefronts s s - 10 spacing; backtrack a bit while s < f rho f-s; if rho Y N < L1y N plot rho X+f rho Y 'color' wavefr_color 'linewidth' wavefr_bdw ; end s s + spacing; end plot the lens fill Lensx Lensy Lens_color 'EdgeColor' Lens_border 'LineWidth' lbw ; get H return Invisible points to force MATLAB to keep the plotting window fixed tiny 0 15 spacing; white 0 999 1 1 1; plot S-tiny H+tiny 'color' white ; plot S-tiny -H-tiny 'color' white ; plot f+tiny H+tiny 'color' white ; plot f+tiny -H-tiny 'color' white ; Rotate by 90 degrees set gca 'View' 90 90 save current file frame_file sprintf 'Frame d eps' 1000+frame_no ; disp frame_file ; saveas gcf frame_file 'psc2' ; pause 0 07 end The frames were converted to a movie with the command convert -antialias -loop 10000 -delay 8 -compress LZW Frame100 Lens_and_wavefronts gif function W rv_vec V K length V ; W V; for i 1 K W i V K-i+1 ; end </source> Animations of electromagnetic waves Files by User Oleg Alexandrov from en wikipedia Animated GIF Focal length diagrams of positive lenses Images with Matlab source code Wavefront | ||||