MAKE A MEME
View Large Image

| View Original: | Ketogenic diets pie.svg (725x1565) | |||
| Download: | Original | Medium | Small | Thumb |
| Courtesy of: | commons.wikimedia.org | More Like This | ||
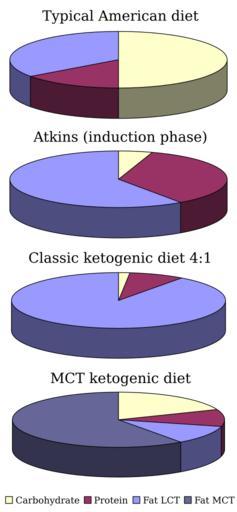
| Keywords: Ketogenic diets pie.svg A series of pie charts depicting the calorific contributions from carbohydrate protein and fat in four diets the typical American diet; the Atkins diet during the induction phase; the classic ketogenic diet in a 4 1 ratio of fat to combined protein and carbohydrate by weight ; and the MCT oil ketogenic diet Sources Last AR Wilson SA http //www aafp org/afp/20060601/1942 html Low-carbohydrate diets Am Fam Physician 2006 Jun 1;73 11 1942-8 PMID 16770923 Huttenlocher PR Wilbourn AJ Signore JM Medium-chain triglycerides as a therapy for intractable childhood epilepsy Neurology 1971 Nov;21 11 1097-103 PMID 5166216 http //www shsna com/pages/ketocal htm SHS KetoCal Cited 18 March 2008 Data values carbohydrate protein fat LCT and fat MCT Percentage of calories Typical American 50 15 35 0 Atkins induction phase 5 35 59 0 Classic ketogenic 1 6 8 4 90 0 MCT ketogenic 19 10 11 60 Vector version of Image Ketogenic diets pie png by Colin 2008-03-18 Colin vectorized by Fvasconcellos PNG version 3D pie charts SVG pie charts Nutrition | ||||