MAKE A MEME
View Large Image

| View Original: | Kaplan-Meier-sample-plot.svg (520x419) | |||
| Download: | Original | Medium | Small | Thumb |
| Courtesy of: | commons.wikimedia.org | More Like This | ||
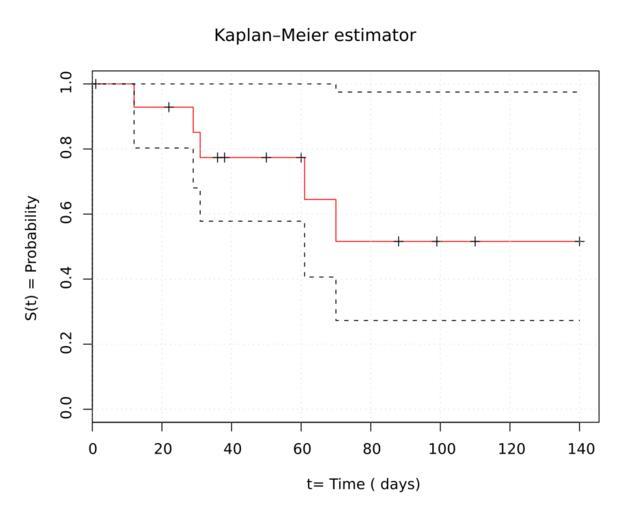
| Keywords: Kaplan-Meier-sample-plot.svg survival curve estimated by Kaplan-Meier method including 95 confidence limits Data is below own Accountalive 2011-05-01 File Bsp_kaplan_meier jpg Data Time of events 1 12 22 29 31 36 38 50 60 61 70 88 99 110 140 Type of event 1 Event e g patient died 0 Censored e g last time patient was seen i e alive don't know if he died later 0 1 0 1 1 0 0 0 0 1 1 0 0 0 0 R source code Made using the following R -code <source lang R> library survival time c 1 12 22 29 31 36 38 50 60 61 70 88 99 110 140 event c 0 1 0 1 1 0 0 0 0 1 1 0 0 0 0 fit survfit Surv time event ~1 plot fit main Beispiel Kaplan-Meier-Schätzer xlab Zeit t Tage ylab Wahrscheinlichkeit S t </source> On image one can see red curve survival curve 2 black curves 95 confidence interval black croses censored observations no event at the time of follow-up event 0 Image was manually translated using switch multiulanguage Cc-zero Translate yes Statistical charts Kaplan “Meier estimator Images with R source code Translation possible - SVG switch | ||||