MAKE A MEME
View Large Image

| View Original: | Hexenanklagen Herzogtum Westfalen 1508–1732.svg (1008x504) | |||
| Download: | Original | Medium | Small | Thumb |
| Courtesy of: | commons.wikimedia.org | More Like This | ||
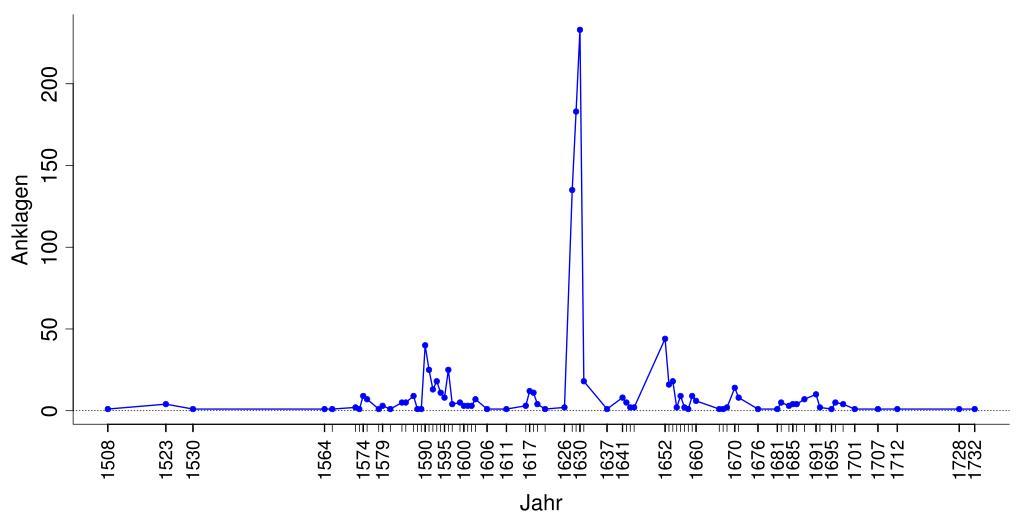
| Keywords: Hexenanklagen Herzogtum Westfalen 1508–1732.svg de Das Diagramm gibt die Zahl der Hexenanklagen im Herzogtum Westfalen zwischen 1508 und 1732 wieder Die Daten sind insofern nicht vollständig weil unbestimmte Angaben wie mehrere einige usw nicht berĂĽcksichtigt wurden Die Daten fĂĽr die Grafik stammen von Rainer Decker Die Hexenverfolgungen im Herzogtum Westfalen In Alfred Bruns Red Hexen Gerichtsbarkeit im kurkölnischen Sauerland Schmallenberg 1984 S 213-218 2011-12-11 own El Grafo thumb left with log-scaled y-axis cc-zero v set working directory setwd /path/to/your/directory/ <- the path to the folder that contains data csv read the data dat <- read csv data csv The default settings for labels and tick marks are not sufficient for this data set so we have to work arond that This vector contains the years we want to be displayed below the x-axis labyears <- c 1508 1523 1530 1564 1574 1579 1590 1595 1600 1606 1611 1617 1626 1630 1637 1641 1652 1660 1670 1676 1681 1685 1691 1695 1701 1707 1712 1728 1732 open an SVG-device svg filename Hexenanklagen Herzogtum Westfalen 1508 “1732 svg width 14 height 7 pointsize 12 set the margins around the plotting area bottom left top right par mar c 6 5 1 1 set up the basic plot plot Angeklagte ~ Jahr data dat bty l type n don't plot any data yet xaxt n don't display any labels or ticks for the x-axis cex axis 1 8 magnify axis by 1 8 cex lab 1 8 magnify labels by 1 8 xlab no title for the x-axis yet ylab Anklagen title for the y-axis add basic ticks for every year in the data set axis 1 x-axis at dat Jahr position of ticks labels FALSE still no labels add selected labels for the x-axis axis 1 x-axis at labyears only the years we defined earlier las 3 vertical labels cex axis 1 5 size of the label text lwd ticks 1 8 add bigger ticks for these labels add a title for the x-axis title xlab Jahr line 5 5 lines below the axis cex lab 1 8 size of the title text add a dashed line at zero abline a 0 b 0 lty 3 plot the lines lines Angeklagte ~ Jahr data dat lwd 1 8 col blue plot the points points Angeklagte ~ Jahr data dat pch 20 col blue cex 1 5 close the device dev off Notes Um die Grafik mit R neu zu erstellen oder zu modifizieren zunächst die Daten im Abschnitt Data in einen Texteditor kopieren und als <tt>data csv</tt> abspeichern Bei Ă„nderungen an der Grafik bitte auch den Code aktualisieren Anmerkung Dieser Code wurde unter Linux erstellt Eventuell funktioniert die SVG-Ausgabe unter Windows nicht Abhilfe sollte das R-Paket <tt>Cairo</tt> in Verbindung mit der Cairo-Grafikbibliothek z B in Inkscape enthalten schaffen To recreate or modify the plot with R copy the Data to your favourite editor and save it as <tt>data csv</tt> If you update the plot please remember to update the code too Note This code was written and tested on a Linux-machine The SVG-export might work differently unter Windows The R-package <tt>Cairo</tt> used together with the cairo graphics library included in Inkscape should do the trick Data <pre> Jahr Angeklagte Hingerichtete 1508 1 1 1523 4 4 1530 1 NA 1564 1 NA 1566 1 NA 1572 2 NA 1573 1 NA 1574 9 9 1575 7 7 1578 1 1 1579 3 3 1581 1 1 1584 5 5 1585 5 4 1587 9 NA 1588 1 NA 1589 1 1 1590 40 NA 1591 25 17 1592 13 6 1593 18 14 1594 11 8 1595 8 8 1596 25 16 1597 4 NA 1599 5 5 1600 3 NA 1601 3 NA 1602 3 NA 1603 7 5 1606 1 1 1611 1 1 1616 3 NA 1617 12 NA 1618 11 1 1619 4 1 1621 1 1 1626 2 2 1628 135 124 1629 183 164 1630 233 192 1631 18 15 1637 1 1 1641 8 NA 1642 5 4 1643 2 NA 1644 2 2 1652 44 41 1653 16 12 1654 18 15 1655 2 1 1656 9 5 1657 2 2 1658 1 1 1659 9 7 1660 6 5 1666 1 1 1667 1 1 1668 2 NA 1670 14 13 1671 8 7 1676 1 NA 1681 1 1 1682 5 2 1684 3 3 1685 4 3 1686 4 1 1688 7 NA 1691 10 10 1692 2 1 1695 1 1 1696 5 1 1698 4 NA 1701 1 1 1707 1 NA 1712 1 NA 1728 1 1 1732 1 NA </pre> Uploaded with UploadWizard Witch hunts Files by User El Grafo | ||||