MAKE A MEME
View Large Image

| View Original: | Hamburg population2.svg (800x400) | |||
| Download: | Original | Medium | Small | Thumb |
| Courtesy of: | commons.wikimedia.org | More Like This | ||
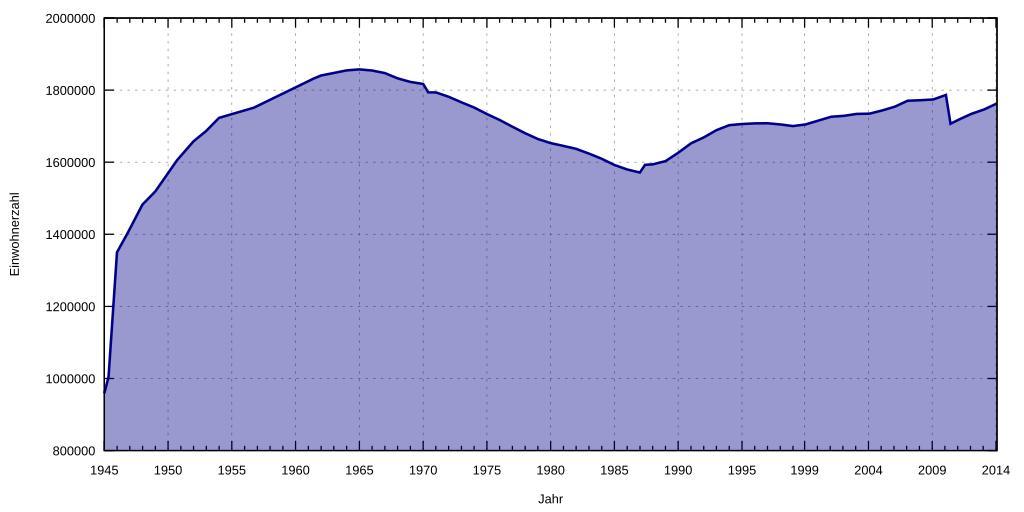
| Keywords: Hamburg population2.svg en Hamburg population statistics since 1945 de Einwohnerentwicklung von Hamburg seit 1945 own ; data from de Einwohnerentwicklung_von_Hamburg Gorgo 2011-03-06 Gnuplot script to generate this plot gnuplot <source lang gnuplot > /usr/bin/gnuplot gnuplot 4 2 / Ubuntu 8 10 input set timefmt d m Y set datafile separator ; output unset key set style data lines set style fill transparent solid 0 4 set grid set xdata time set xlabel 'Jahr' set xrange '01 01 1945' '31 12 2009' set xtics 157680000 set mxtics 5 set format x ' Y' set ylabel 'Einwohnerzahl' set ytics 200000 set format y ' 0f' set yrange 800000 set term svg size 800 400 font Arial 10 set output 'hamburg_population2 svg' plot '-' using 1 2 with filledcurves below x1 lt rgb 'dark-blue' lw 2 30 06 950;500 30 06 1050;900 30 06 1200;1500 30 06 1300;5000 30 06 1430;16000 30 06 1560;20000 30 06 1600;40000 30 06 1650;60000 30 06 1750;75000 30 06 1787;100000 30 06 1800;130000 30 06 1811;106983 30 06 1814;55000 30 06 1826;122861 03 12 1834;130385 03 12 1837;135375 03 12 1840;136956 03 12 1846;148754 03 12 1852;161390 03 12 1855;166148 03 12 1858;171696 03 12 1861;178841 03 12 1864;175700 03 12 1867;225074 01 12 1871;240251 01 12 1875;264675 01 12 1880;289859 01 12 1885;305690 01 12 1890;323923 02 12 1895;625552 01 12 1900;705738 31 12 1901;725971 31 12 1902;739747 31 12 1903;754261 31 12 1904;776354 01 12 1905;802793 31 12 1906;830578 31 12 1907;856226 31 12 1908;881874 31 12 1909;907522 01 12 1910;931035 31 12 1911;946236 31 12 1912;1000903 31 12 1913;1031480 01 12 1916;876833 05 12 1917;846055 08 10 1919;985779 31 12 1919;1004427 31 12 1920;1026989 31 12 1921;1041057 31 12 1922;1071924 31 12 1923;1066991 31 12 1924;1089091 16 06 1925;1079126 31 12 1925;1087049 31 12 1926;1101132 31 12 1927;1115511 31 12 1928;1131599 31 12 1929;1145014 31 12 1930;1145124 31 12 1931;1135317 31 12 1932;1123500 16 06 1933;1129307 31 12 1933;1127917 31 12 1934;1112195 31 12 1935;1101105 31 12 1936;1096796 31 12 1937;1094715 31 12 1938;1689100 17 05 1939;1711877 31 12 1940;1725500 31 12 1944;958247 01 05 1945;1004325 31 12 1945;1350278 29 10 1946;1403300 31 12 1947;1482639 31 12 1948;1518900 13 09 1950;1605606 31 12 1951;1658038 31 12 1952;1687190 31 12 1953;1722819 25 09 1956;1751289 06 06 1961;1832346 31 12 1961;1840543 31 12 1962;1847523 31 12 1963;1854637 31 12 1964;1857431 31 12 1965;1854361 31 12 1966;1847267 31 12 1967;1832560 31 12 1968;1822837 31 12 1969;1817122 27 05 1970;1793823 31 12 1970;1793640 31 12 1971;1781621 31 12 1972;1766214 31 12 1973;1751621 31 12 1974;1733802 31 12 1975;1717383 31 12 1976;1698615 31 12 1977;1680340 31 12 1978;1664305 31 12 1979;1653043 31 12 1980;1645095 31 12 1981;1637132 31 12 1982;1623848 31 12 1983;1609531 31 12 1984;1592447 31 12 1985;1579884 31 12 1986;1571267 25 05 1987;1592770 31 12 1987;1594190 31 12 1988;1603070 31 12 1989;1626220 31 12 1990;1652363 31 12 1991;1668757 31 12 1992;1688785 31 12 1993;1702887 31 12 1994;1705872 31 12 1995;1707901 31 12 1996;1707986 31 12 1997;1704731 31 12 1998;1700089 31 12 1999;1704735 31 12 2000;1715392 31 12 2001;1726363 31 12 2002;1728806 31 12 2003;1734083 31 12 2004;1734830 31 12 2005;1743627 31 12 2006;1754182 31 12 2007;1770629 31 12 2008;1772100 31 12 2009;1774224 e </source> Cc-zero Temporal population graphs of Hamburg Hamburg History of Hamburg Images with Gnuplot source code | ||||