MAKE A MEME
View Large Image

| View Original: | Graph WP extended growth 2025.gif (400x280) | |||
| Download: | Original | Medium | Small | Thumb |
| Courtesy of: | commons.wikimedia.org | More Like This | ||
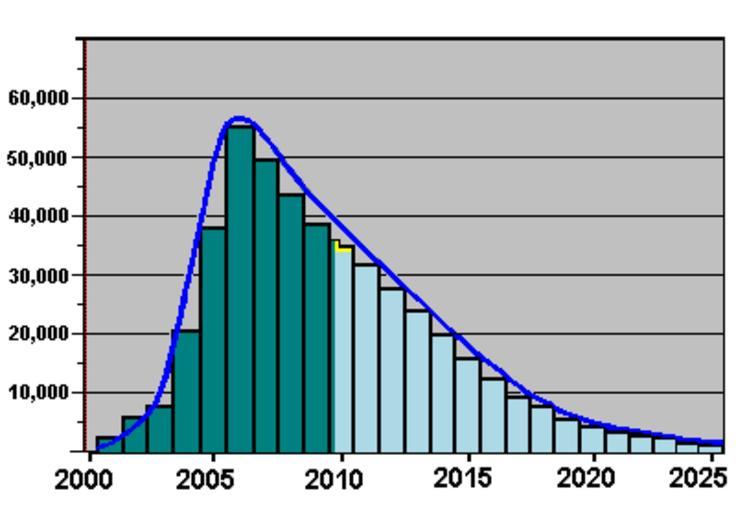
| Keywords: Graph WP extended growth 2025.gif Graph of English Wikipedia growth in new articles added per month The dark bars represent past growth rates The light-blue bars are projected monthly rates rough guesses for future years The pattern is somewhat analogous to a negative binomial distribution but altered by events causing unusual changes in new-article rates See essay w Wikipedia Modelling Wikipedia extended growth Own 2009-02-22 Wikid77 none yet Outdated wikipedia trends Trend analysis English Wikipedia statistics | ||||