MAKE A MEME
View Large Image

| View Original: | Gdp to debt ratio.svg (1440x1152) | |||
| Download: | Original | Medium | Small | Thumb |
| Courtesy of: | commons.wikimedia.org | More Like This | ||
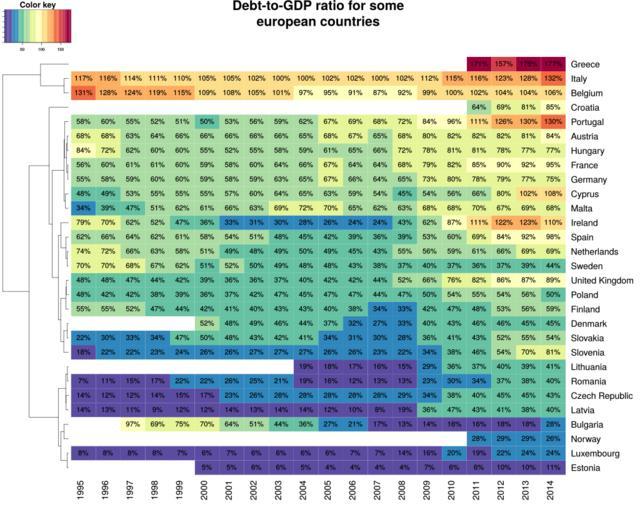
| Keywords: Gdp to debt ratio.svg Staatsschuldenquote pdf Data are updated countries are reordered such that countries with similar ratio development are located nearby and colors are changed to reflect sizes better as well as to improve for color blind people 2015-05-31 own Sigbert other versions Created with R trim <- function x gsub \\s+ \\s+ x reorder <- function d wts stats reorder d wts agglo FUN mean dist <- function q nc <- nrow q qm <- as matrix q d <- matrix NA ncol nc nrow nc for i in 1 nc di <- apply abs sweep qm 2 qmi 1 median na rm T rownames d <- colnames d <- rownames q as dist d library foreign library RColorBrewer library gplots library countrycode x <- read spss gov_10dd_edpt1 sav to data frame T x valuex value <- NA quote <- data frame COUNTRY trim x GEO YEAR as numeric as character x TIME RATIO as numeric as character x value quote <- reshape quote idvar COUNTRY timevar YEAR direction wide nq <- countrycode as character quote- 1 7 1 iso2c country name nqc 8 28 <- c Greece United Kingdom quote <- quote-c 1 7 -1 rownames quote <- nq colnames quote <- as character 1994+seq ncol quote colfun <- rev brewer pal 11 Spectral note <- apply as matrix quote c 1 2 function elem if is na elem return ; sprintf 0f elem svg gdp_to_debt_ratio svg width 20 height 16 par cex main 2 heatmap 2 as matrix quote scale none col colfun margins c 7 14 Colv NA distfun dist reorderfun reorder tracecol NA main Debt-to-GDP ratio for some\neuropean countries cexRow 2 cexCol 2 cellnote note notecol black notecex 1 6 key title Color key key ylab key xlab key par list mar c 3 1 2 0 keysize 0 5 dev off cc-zero Uploaded with UploadWizard SVG diagrams Statistical charts | ||||