MAKE A MEME
View Large Image

| View Original: | Gauss-chebychev-integration.svg (377x522) | |||
| Download: | Original | Medium | Small | Thumb |
| Courtesy of: | commons.wikimedia.org | More Like This | ||
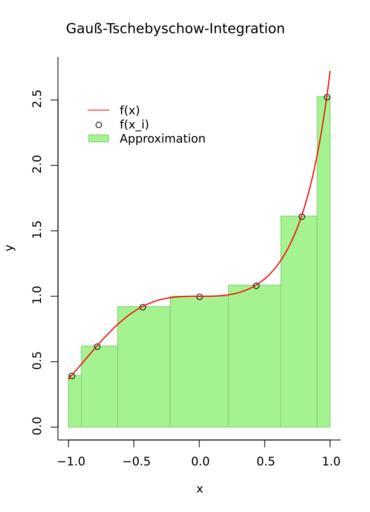
| Keywords: Gauss-chebychev-integration.svg Gauß-Chebychev-Integration/quadrature de Beispiel für Gauß-Tschebyschow-Integration/Quadraturhttp //de wikipedia org/wiki/Gau C3 9F-Quadratur Gau C3 9F-Tschebyschow-Integration own Accountalive 2011-05-02 Created with w R-Project using the following code <source lang R> f <- function x exp x 3 n 7 xi cos 2 n 1 -1 / 2 n pi w pi/n width w sqrt 1-xi 2 sum width f xi print approximated integral plot axis and labels range -100 100 /100 maxx sum width /2 plot range f range xlim 1 05 c -1 maxx maxx ylim c 0 01045 max f range type n col 2 bty l main Gauß-Tschebyschow-Integration\nn 7 xlab x ylab y height f xi recangles may start at < -1 curx -sum width /2 plot green boxes for i in 1 n y c 0 heighti heighti 0 x c curx curx curx+widthi curx+widthi polygon x y density -1 border hsv 0 3 0 4 0 8 col hsv 0 3 0 4 0 95 curx curx+widthi plot x_i f x_i lines xi height type p plot f x lines range f range type l col 2 lwd 1 5 legend -1 y 2 5 c f x f x_i Approximation bty n col c red black pch c NA 1 NA lty c 1 0 0 fill c NA NA hsv 0 3 0 4 0 95 border c NA NA hsv 0 3 0 4 0 8 ; abline 1 1 to see whether plot has 1 1 aspect ratio </source> Cc-zero Numeric integration graphs Pafnuty Chebyshev Images with R source code | ||||