MAKE A MEME
View Large Image

| View Original: | Galton Watson survival Poisson.png (540x540) | |||
| Download: | Original | Medium | Small | Thumb |
| Courtesy of: | commons.wikimedia.org | More Like This | ||
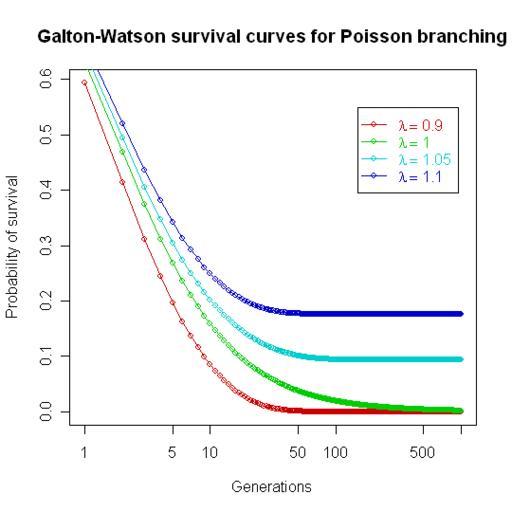
| Keywords: Galton Watson survival Poisson.png diagram Plot of Galton-Watson survival rates for Poisson processes with Poisson constants 0 9 1 0 1 05 1 1; illustrating the zero limiting survival probability if the Poisson rate < 1 and the perhaps surprisingly low survival probabilities even if the population as a whole is increasing exponentially with a Poisson rate > 1 Created in the R statistics environment exported as PNG probability theory | ||||