MAKE A MEME
View Large Image
| View Original: | Friedmans mars linear model.png (240x240) | |||
| Download: | Original | Medium | Small | Thumb |
| Courtesy of: | commons.wikimedia.org | More Like This | ||
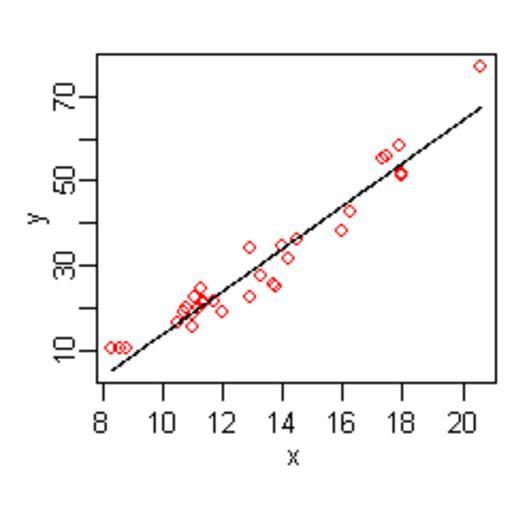
| Keywords: Friedmans mars linear model.png en Plot of a simple linear model for comparison to the Friedman's Multivariate Adaptive Splines Regression MARS model in Friedmans_mars_simple_model png Generated by the author from the trees dataset using the earth library in the R statistical package Stephen Milborrow 2008-07-16 Generated from within the R statistical language as follows a <- earth Volume~Girth data trees linpred 1 linear model with earth so can use plotmo png filename friedmans_mars_linear_model png pointsize 18 width 240 height 240 plotmo a caption col response red clip 0 xlab x ylab y main dev off Linear regression | ||||