MAKE A MEME
View Large Image

| View Original: | European immigration to the United States 1881-1940.png (1566x1102) | |||
| Download: | Original | Medium | Small | Thumb |
| Courtesy of: | commons.wikimedia.org | More Like This | ||
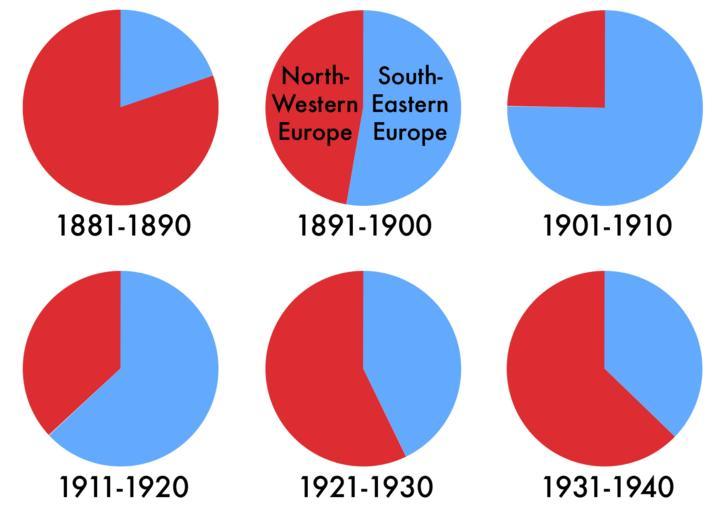
| Keywords: European immigration to the United States 1881-1940.png Relative proportions of European immigrants to the United States from 1881-1940 from North-Western and South-Eastern Europe by decade The effects of immigration restriction legislation in the early 1920s can be easily seen Created by User Fastfission in Microsoft Excel and Adobe Photoshop Font is Futura Medium Source Data derived from Statistical Abstract of the United States 1942 Chart No 113 Immigration by Country of Origin by Decades 1851-1940 The numbers used for these charts were <table> <tr><th></th><th>1881-1890</th><th>1891-1900</th><th>1901-1910</th><th>1911-1920</th><th>1921-1930</th><th>1931-1940</th></tr> <tr><th>South-Eastern Europe</th><td>936334</td><td>1879125</td><td>6128232</td><td>2758267</td><td>1063013</td><td>129174</td></tr> <tr><th>North-Western Europe</th><td>3800652</td><td>1680453</td><td>2007784</td><td>1618297</td><td>1414760</td><td>219123</td></tr> </table> The numbers are not precise but the proportions should be accurate Known errors are that some of the countries are counted differently depending on the period in time Austria gets counted with Germany sometimes with Hungary others There were no doubt some transcription errors too as the copy of this volume on Google Books is somewhat hard to read The distinction between North Western and South Eastern was made primarily by me with reference to the categories used http //historymatters gmu edu/d/5078/ on this page which I thought seemed sensible Fastfission If you want to credit someone credit Wikimedia Commons Otherwise don't credit anyone that's fine by me --Fastfission 15 12 14 April 2008 UTC Immigration USA Eugenics Pie charts US-Immigration | ||||