MAKE A MEME
View Large Image

| View Original: | EfieldTwoOppositePointCharges.svg (618x437) | |||
| Download: | Original | Medium | Small | Thumb |
| Courtesy of: | commons.wikimedia.org | More Like This | ||
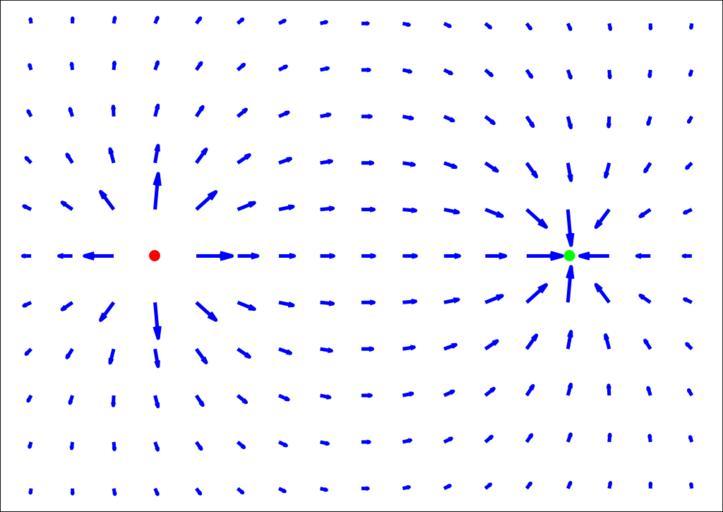
| Keywords: EfieldTwoOppositePointCharges.svg Illustration of the electric vectorfield surrounding two opposite point charges Red is positive green is negative Own work Vectorfield plotted in Matlab using the 'quiver' function Exported in Encapsulated Postscript EPS format; converted to Scalable Vector Graphics SVG format in GSView using 'plot-svg' via GNU libplot Added circle drawings in Inkscape GNU General Public License 2006-08-12 User Mfrosz Free for use by anyone for anything but please give credit to Wikimedia or Wikipedia Dipoles | ||||