MAKE A MEME
View Large Image

| View Original: | Duisburg population.svg (800x400) | |||
| Download: | Original | Medium | Small | Thumb |
| Courtesy of: | commons.wikimedia.org | More Like This | ||
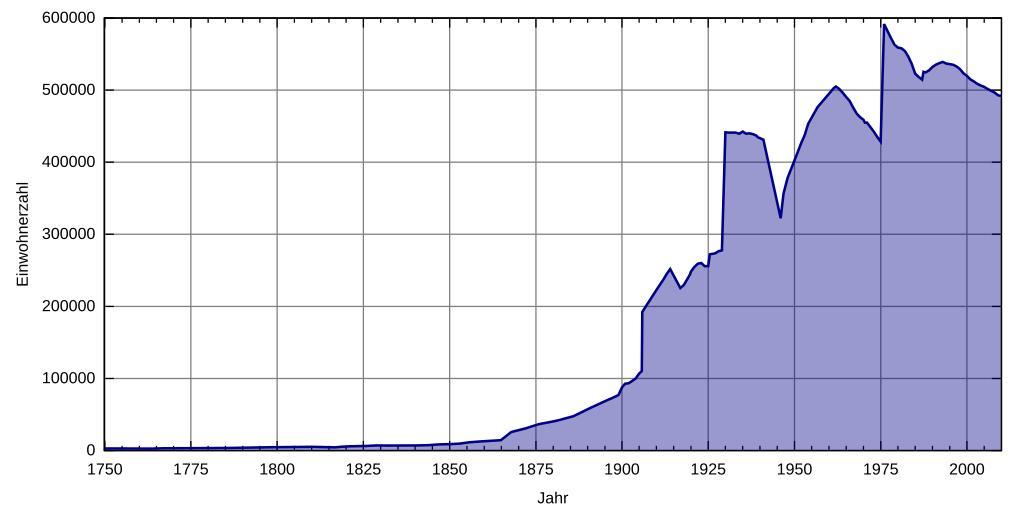
| Keywords: Duisburg population.svg en Duisburg population statistics since 1750 de Einwohnerentwicklung von Duisburg seit 1750 own ; data from de Einwohnerentwicklung_von_Duisburg Gorgo 2011-03-10 File Duisburg population sv svg Created with Gnuplot /usr/bin/gnuplot gnuplot 4 2 / Ubuntu 8 10 input set timefmt d m Y set datafile separator ; output unset key set style data lines set style fill transparent solid 0 4 set grid set xdata time set xlabel 'Jahr' set xrange '01 01 1750' '31 12 2009' set xtics 788400000 set mxtics 5 set format x ' Y' set ylabel 'Einwohnerzahl' set ytics 100000 set format y ' 0f' set term svg size 800 400 font Arial 10 set output 'duisburg_population svg' plot '-' using 1 2 with filledcurves below x1 lt rgb 'dark-blue' lw 2 30 06 1714;2983 30 06 1722;2935 30 06 1740;2793 30 06 1756;2874 30 06 1763;2678 30 06 1767;3227 30 06 1770;3134 30 06 1777;3342 30 06 1784;3531 30 06 1787;3657 30 06 1798;4530 30 06 1810;5195 01 12 1816;4508 01 12 1818;5364 01 12 1820;5936 01 12 1825;6408 01 12 1828;7058 01 12 1831;7005 03 12 1840;7021 03 12 1843;7506 03 12 1846;8543 03 12 1849;8948 03 12 1852;9579 03 12 1855;11629 03 12 1858;12674 03 12 1861;13422 03 12 1864;14368 03 12 1867;25757 01 12 1871;30533 01 12 1875;36580 01 12 1880;41249 01 12 1885;47519 01 12 1890;59285 02 12 1895;70272 31 12 1896;72460 31 12 1897;74780 31 12 1898;77090 31 12 1899;87510 01 12 1900;92729 31 12 1901;93320 31 12 1902;96620 31 12 1903;100050 31 12 1904;106770 30 09 1905;110317 01 12 1905;192346 31 12 1906;200392 31 12 1907;207819 31 12 1908;215246 31 12 1909;222673 01 12 1910;229483 31 12 1911;237129 31 12 1912;245021 31 12 1913;251750 01 12 1916;225545 05 12 1917;229584 08 10 1919;244302 31 12 1919;248225 31 12 1920;254887 31 12 1921;259314 31 12 1922;260169 31 12 1923;255677 31 12 1924;255799 16 06 1925;272252 31 12 1925;272736 31 12 1926;273492 31 12 1927;276495 31 12 1928;277671 31 12 1929;441389 31 12 1930;441158 31 12 1931;441107 31 12 1932;441139 16 06 1933;440419 31 12 1933;439483 31 12 1934;442513 31 12 1935;439627 31 12 1936;440100 31 12 1937;438861 31 12 1938;436800 17 05 1939;434646 31 12 1940;431300 31 12 1945;322301 29 10 1946;356408 31 12 1947;378289 13 09 1950;410783 31 12 1951;426853 31 12 1952;437616 31 12 1953;453311 25 09 1956;476523 06 06 1961;502993 31 12 1961;504975 31 12 1962;501616 31 12 1963;496354 31 12 1964;490374 31 12 1965;484930 31 12 1966;475858 31 12 1967;467780 31 12 1968;462572 31 12 1969;458916 27 05 1970;454839 31 12 1970;454885 31 12 1971;448791 31 12 1972;442386 31 12 1973;435281 31 12 1974;428594 31 12 1975;591635 31 12 1976;581971 31 12 1977;572101 31 12 1978;563088 31 12 1979;559066 31 12 1980;558089 31 12 1981;554377 31 12 1982;546566 31 12 1983;536402 31 12 1984;522829 31 12 1985;518260 31 12 1986;514628 25 05 1987;525378 31 12 1987;524502 31 12 1988;527447 31 12 1989;532152 31 12 1990;535447 31 12 1991;537441 31 12 1992;539094 31 12 1993;536797 31 12 1994;536106 31 12 1995;535250 31 12 1996;532701 31 12 1997;529062 31 12 1998;523311 31 12 1999;519793 31 12 2000;514915 31 12 2001;512030 31 12 2002;508664 31 12 2003;506496 31 12 2004;504403 31 12 2005;501564 31 12 2006;499111 31 12 2007;496665 31 12 2008;492870 31 12 2009;491931 e Cc-zero Temporal population graphs of North Rhine-Westphalia Statistics of Duisburg | ||||