MAKE A MEME
View Large Image
| View Original: | Differentialsusceptibilitymodel.JPG (885x661) | |||
| Download: | Original | Medium | Small | Thumb |
| Courtesy of: | commons.wikimedia.org | More Like This | ||
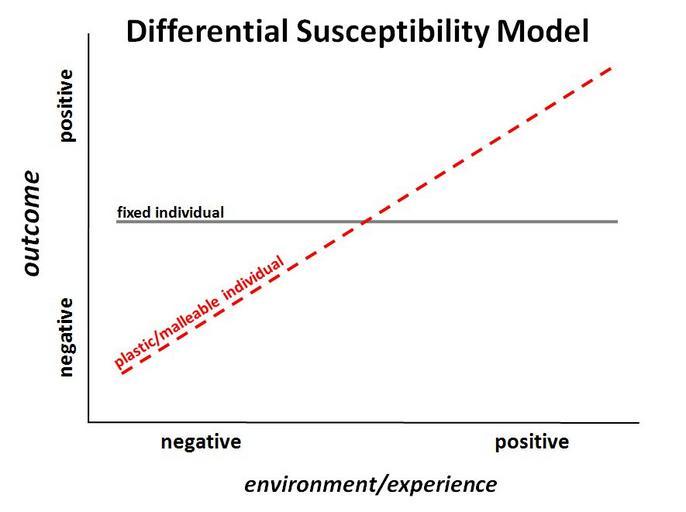
| Keywords: Differentialsusceptibilitymodel.JPG en Figure 2 Graphical display of the differential susceptibility model The X-axis indicates quality of the environment/experiences from negative to positive The Y-axis indicates the developmental outcome from negative to positive The lines depict two categorical groups that differ in their responsiveness to the environment the plastic group is disproportionately more affected by both negative and positive environments compared to the fixed group Own Mpluess Differentialsusceptibilitymodel svg Check categories 2009 November 12 en wikipedia Differential_susceptibility_hypothesis 6 Psychology | ||||