MAKE A MEME
View Large Image

| View Original: | Diffeq.png (640x480) | |||
| Download: | Original | Medium | Small | Thumb |
| Courtesy of: | commons.wikimedia.org | More Like This | ||
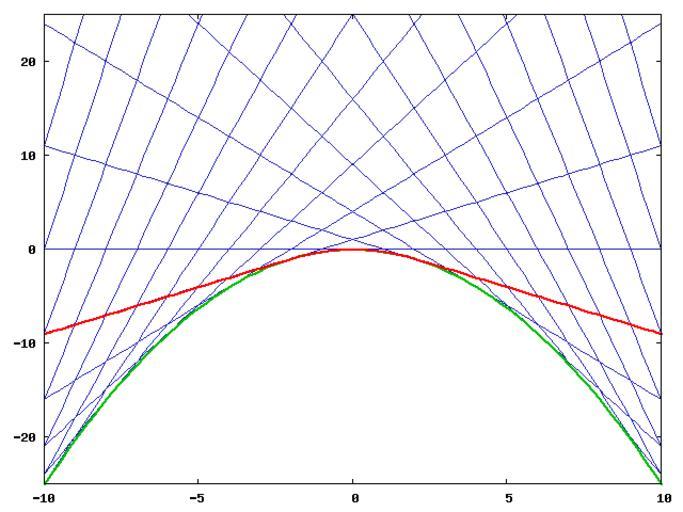
| Keywords: Diffeq.png Shows the solutions to the equation <math> y' 2 + x y' - y 0\ </math> Some of the particular solutions are in blue; the singular solution is in green; and a hybrid solution is in red I used this image on Wikipedia's ODE page to illustrate the different types of solution baccala freesoft org 29 Oct 2005 2005-10-29 own assumed Baccala freesoft org~commonswiki Source <pre> /usr/bin/gnuplot set terminal png set output diffeq png set key off set style line 1 lt 8 set style line 2 lt 2 lw 3 set style line 3 lt 1 lw 3 set yzeroaxis lt -1 set parametric plot x -10 10 -10 10 -25 25 \ x 0 ls 1 \ x x+1 ls 1 \ x -x+1 ls 1 \ x 2 x+4 ls 1 \ x -2 x+4 ls 1 \ x 3 x+9 ls 1 \ x -3 x+9 ls 1 \ x 4 x+16 ls 1 \ x -4 x+16 ls 1 \ x 5 x+25 ls 1 \ x -5 x+25 ls 1 \ x 6 x+36 ls 1 \ x -6 x+36 ls 1 \ x 7 x+49 ls 1 \ x -7 x+49 ls 1 \ x 8 x+64 ls 1 \ x -8 x+64 ls 1 \ x 9 x+81 ls 1 \ x -9 x+81 ls 1 \ x 10 x+100 ls 1 \ x -10 x+100 ls 1 \ x 11 x+121 ls 1 \ x -11 x+121 ls 1 \ x - 25 x x ls 2 \ x-12 x-12 +1 ls 3 \ x+12 - x+12 +1 ls 3 \ x/5 - 25 x/5 x/5 ls 3 </pre> <pre> MatLab code h figure hold on box on x -10 10; plot x 0 0 ; V 1 1 11; for i 1 numel V plot x V i x+V i 2 'b' x -V i x+V i 2 'b' ; end x -10 0 1 10; plot x -0 25 x x 'g' 'LineWidth' 3 ; plot x-12 x-12 +1 'r' 'LineWidth' 2 ; plot x+12 - x+12 +1 'r' 'LineWidth' 2 ; plot x/5 - 01 x x 'r' 'LineWidth' 2 ; axis -10 10 -25 25 ; axis square </pre> differential equations Envelopes mathematics | ||||