MAKE A MEME
View Large Image

| View Original: | Curve fitting.svg (576x432) | |||
| Download: | Original | Medium | Small | Thumb |
| Courtesy of: | commons.wikimedia.org | More Like This | ||
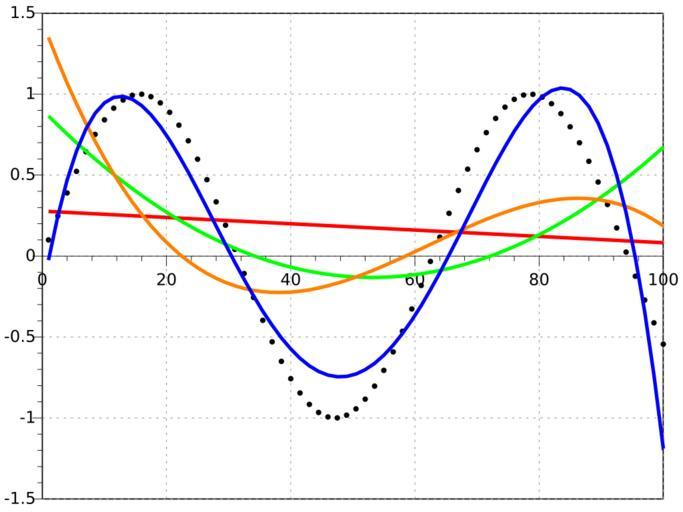
| Keywords: Curve fitting.svg en This graph shows a series of points generated by a Sin function approximated by polinomial curves red curve is linear green is quadratic orange is cubic and blue is 4th degree it Il grafo mostra una serie di punti generati dalla funzione seno approssimati da curve polinomiali in rosso di primo grado verde di secondo arancione di terzo e verde di quarto own Krishnavedala 2011-09-06 File Curve fitting jpg validSVG GNU Octave source code <syntaxhighlight lang matlab> x 1 1 5 100; y sin x/10 ; p1 polyfit x y 1 ; p2 polyfit x y 2 ; p4 polyfit x y 4 ; p3 polyfit x y 3 ; figure; plot x y 'k ' ; hold all plot x polyval p1 x 'r' ; plot x polyval p2 x 'g' ; plot x polyval p3 x 'color' 1 5 0 ; plot x polyval p4 x 'b' ; grid on set gca 'xaxislocation' 'zero' set gca 'yaxislocation' 'zero' box off print 'Curve fitting svg' </syntaxhighlight> cob Python source Code Created using python with numpy and matplotlib toolboxes <source lang python > from numpy import from matplotlib pyplot import from mpl_toolkits axes_grid axislines import SubplotZero x linspace 0 100 75 y sin 2 pi x/60 + 4 y1 poly1d polyfit x y 1 linear y2 poly1d polyfit x y 2 quadratic y3 poly1d polyfit x y 3 cubic y4 poly1d polyfit x y 4 4th degree fig figure figsize 6 4 ax SubplotZero fig 111 fig add_subplot ax ax grid True ax plot x y1 x 'r' label u'linear' ax plot x y2 x 'g' label u'quadratic' ax plot x y3 x 'orange' label u'cubic' ax plot x y4 x 'b' label u' 4 th order' ax plot x y 'k ' label u'data' ax set_xlabel u'x' ax set_ylabel u'y' ax minorticks_on ax legend frameon False loc 4 labelspacing 2 setp ax get_legend get_texts fontsize 'small' fig savefig Curve fitting svg bbox_inches tight pad_inches 15 </source> cob Cc-zero Created with Matplotlib Images with Python source code Curve interpolation Images with Octave source code | ||||