MAKE A MEME
View Large Image

| View Original: | CriticalFrequencyAliasing.svg (600x480) | |||
| Download: | Original | Medium | Small | Thumb |
| Courtesy of: | commons.wikimedia.org | More Like This | ||
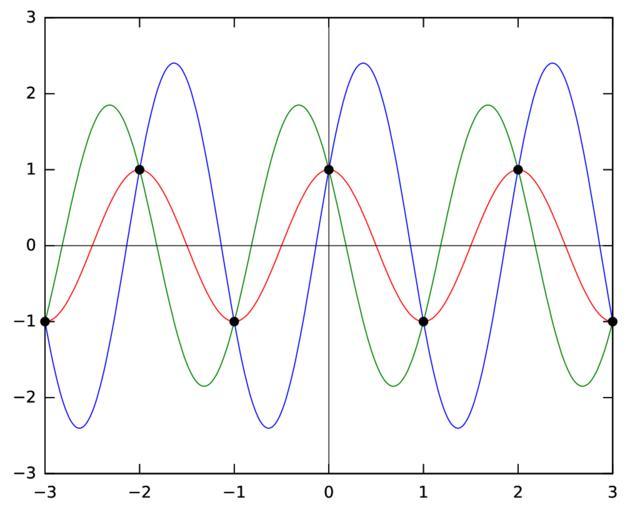
| Keywords: CriticalFrequencyAliasing.svg en Plot of some sinusoids with the critical frequency one half cycle per sample all having samples alternating between +1 and -1 at integer values of t/T Created from scratch with gnuplot based on idea from original bitmap version Qef 2008-07-01 Original low resolution bitmap version http //en wikipedia org/wiki/Image CriticalFrequencyAliasing png Alternative higher resolution bitmap version http //commons wikimedia org/wiki/Image CriticalFrequencyAliasing png Created with Gnuplot set terminal svg font Bitstream Vera Sans set output CriticalFrequencyAliasing svg set xrange -3 3 set yrange -3 3 set xzeroaxis linetype -1 linewidth 0 5 set yzeroaxis linetype -1 linewidth 0 5 set key off set samples 300 plot f x 1/cos a cos pi x+a \ a 0 f x \ a 1 f x \ a 2 f x plot CriticalFrequencyAliasing points \ with points pointtype 7 linetype rgbcolor black The 'CriticalFrequencyAliasing points' file contains the following Created with Gnuplot -3 -1 -2 1 -1 -1 0 1 1 -1 2 1 3 -1 Finally after running Gnuplot I post-processed the image with 'sed' to tweak the axis labels changing hyphens to real minus signs <pre>sed 's/<text>-/<text>\xE2\x88\x92/g' <input svg >output svg</pre> Signal processing Nyquist Shannon theorem | ||||