MAKE A MEME
View Large Image

| View Original: | Continuous in x and y but non continuous.png (1228x941) | |||
| Download: | Original | Medium | Small | Thumb |
| Courtesy of: | commons.wikimedia.org | More Like This | ||
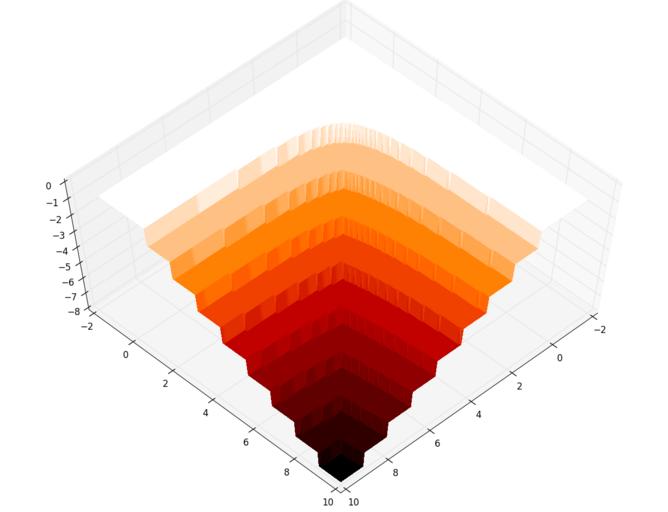
| Keywords: Continuous in x and y but non continuous.png en 3D plop of the bivariable function <math> f x y \begin cases This function is continuous in x and y both and respectively but overall non continuous \frac y x -y \text if 1 \geq x > y \geq 0 \\ \frac x y -x \text if 1 \geq y > x \geq 0 \\ 1-x \text if x y>0 \\ 0 \text else \end cases </math> fr Représentation en 3D de la fonction de deux variables <math> f x y \begin cases \frac y x -y \text if 1 \geq x > y \geq 0 \\ \frac x y -x \text if 1 \geq y > x \geq 0 \\ 1-x \text if x y>0 \\ 0 \text else \end cases </math> Cette fonction est continue par rapport à x et y respectivement mais n'est pas continue own TomT0m 2016-12-14 Figure generated by the python script <syntaxhighlight lang python > from mpl_toolkits mplot3d import Axes3D from matplotlib import cm from matplotlib ticker import LinearLocator FormatStrFormatter import matplotlib pyplot as plt import numpy as np def plop X Y if X> 1 and X>Y and Y> 0 return Y/X -Y elif Y> 1 and Y>X and X> 0 return X/Y -X elif X Y and Y>0 return 1-X else return 0 def plop_py func fig plt figure ax fig gca projection '3d' myfunc np vectorize func x fig gca projection '3d' X np arange -1 10 0 05 Y np arange -1 10 0 05 X Y np meshgrid X Y Z myfunc X Y surf ax plot_surface X Y Z rstride 2 cstride 1 cmap cm gist_heat linewidth 0 antialiased False shade False plt show plop_py plop </syntaxhighlight> Cc-zero | ||||