MAKE A MEME
View Large Image

| View Original: | Cones and Photopic smj2.png (356x265) | |||
| Download: | Original | Medium | Small | Thumb |
| Courtesy of: | commons.wikimedia.org | More Like This | ||
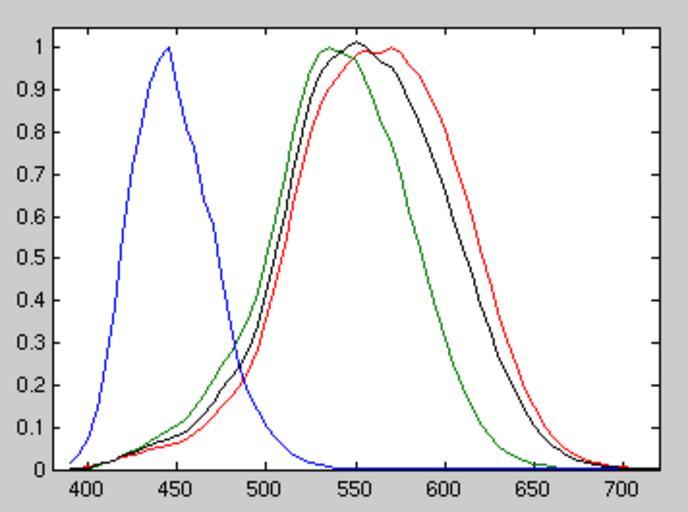
| Keywords: Cones and Photopic smj2.png en wikipedia 2012 February 21 en I made this in matlab and screen captured it as a quick hack from quantal data at http //www cvrl org/database/text/cones/smj2 htm The black curve is a linear combination of the long and medium cone responses and represents the photopic luminosity function Probably other data sets are less lumpy Here's the code http //www cvrl org/database/text/cones/smj2 htm conelogQdata 390 -3 0536 -3 1218 -1 8575 395 -2 6325 -2 6873 -1 4547 400 -2 3323 -2 3991 -1 1582 405 -2 0247 -2 0729 -0 8393 410 -1 7957 -1 8257 -0 6069 415 -1 6600 -1 6650 -0 4141 420 -1 5187 -1 4822 -0 2550 425 -1 4501 -1 3680 -0 1432 430 -1 3922 -1 2659 -0 0835 435 -1 3344 -1 1736 -0 0378 440 -1 2716 -1 0844 -0 0103 445 -1 2323 -1 0269 0 0000 450 -1 1974 -0 9771 -0 0408 455 -1 1460 -0 9159 -0 0921 460 -1 0725 -0 8364 -0 1178 465 -0 9894 -0 7564 -0 1928 470 -0 9006 -0 6754 -0 2351 475 -0 8224 -0 6067 -0 3359 480 -0 7603 -0 5561 -0 4687 485 -0 7056 -0 5121 -0 6037 490 -0 6324 -0 4519 -0 7369 495 -0 5422 -0 3785 -0 8579 500 -0 4505 -0 3036 -0 9869 505 -0 3575 -0 2249 -1 1168 510 -0 2766 -0 1596 -1 2672 515 -0 2050 -0 1025 -1 4381 520 -0 1440 -0 0545 -1 6145 525 -0 0984 -0 0239 -1 8070 530 -0 0645 -0 0056 -1 9975 535 -0 0434 0 0000 -2 1850 540 -0 0312 -0 0036 -2 3691 545 -0 0177 -0 0066 -2 5498 550 -0 0065 -0 0139 -2 7273 555 -0 0023 -0 0318 -2 9016 560 -0 0053 -0 0597 -3 0728 565 -0 0050 -0 0874 -3 2411 570 0 0000 -0 1132 -3 4064 575 -0 0048 -0 1560 -3 5689 580 -0 0171 -0 2128 -3 7286 585 -0 0289 -0 2694 -3 8856 590 -0 0444 -0 3343 -4 0400 595 -0 0668 -0 4155 -4 1919 600 -0 0954 -0 5065 -4 3412 605 -0 1301 -0 6048 -4 4880 610 -0 1725 -0 7153 -4 6326 615 -0 2231 -0 8382 -4 7747 620 -0 2824 -0 9675 -4 9146 625 -0 3510 -1 1030 -5 0523 630 -0 4299 -1 2484 -5 1879 635 -0 5179 -1 4024 -5 3213 640 -0 6131 -1 5588 -5 4527 645 -0 7169 -1 7152 -5 5821 650 -0 8318 -1 8748 -5 7096 655 -0 9581 -2 0376 -5 8350 660 -1 0928 -2 2038 -5 9586 665 -1 2337 -2 3715 -6 0804 670 -1 3788 -2 5374 -6 2004 675 -1 5257 -2 6991 -6 3186 680 -1 6747 -2 8577 -6 4351 685 -1 8271 -3 0183 -6 5500 690 -1 9841 -3 1809 -6 6632 695 -2 1495 -3 3474 -6 7747 700 -2 3213 -3 5155 -6 8848 705 -2 4916 -3 6812 -6 9932 710 -2 6521 -3 8405 -7 1003 715 -2 8055 -3 9935 -7 2057 720 -2 9676 -4 1481 -7 3098 725 -3 1275 -4 3010 -7 4125 730 -3 2852 -4 4521 -7 5137 ; lambda conelogQdata 1 ; responses 10 conelogQdata 2 3 4 ; photopic responses 1 2 0 68273; 0 35235; figure 1 ; hold off plot lambda responses hold on plot lambda photopic 'k' hold off axis 380 720 0 1 05 en wikipedia Premeditated Chaos CommonsHelper 2007-05-25 Dicklyon wikipedia en DrTrigonBot <span class signature-talk >talk</span> FileContentsByBot/ColorRegions FileContentsByBot/ColorRegions 0 820 0 092 PMS 14-4203 TPX Vapor Blue Pantone 189 190 191 25 690 191 191 192 0 249 0 0 353 262 0 567 1 155 144 FileContentsByBot/ColorRegions 0 960 0 036 PMS 11-0601 TPX Bright White Pantone 241 242 241 8 016 245 245 245 0 751 27 13 312 229 1 004 2 184 126 FileContentsByBot/ColorAverage 0 057 PMS 11-4201 TPX Cloud Dancer Pantone 240 241 240 0 083 232 232 232 0 158 1 398 FileContentsByBot/Properties - 356 265 PNG 1 image/png RGB 7459 Dicklyon Original upload log page en wikipedia Cones_and_Photopic_smj2 png 2007-05-25 05 00 Dicklyon 356×265× 7459 bytes <nowiki>I made this in matlab and screen captured it as a quick hack from quantal data at http //www cvrl org/database/text/cones/smj2 htm The black curve is a linear combination of the long and medium cone responses and represents the photopic luminosity f</nowiki> Categorized by DrTrigonBot Color vision | ||||