MAKE A MEME
View Large Image

| View Original: | Comparison of periodogram and Welch methods of spectral density estimation.png (544x662) | |||
| Download: | Original | Medium | Small | Thumb |
| Courtesy of: | commons.wikimedia.org | More Like This | ||
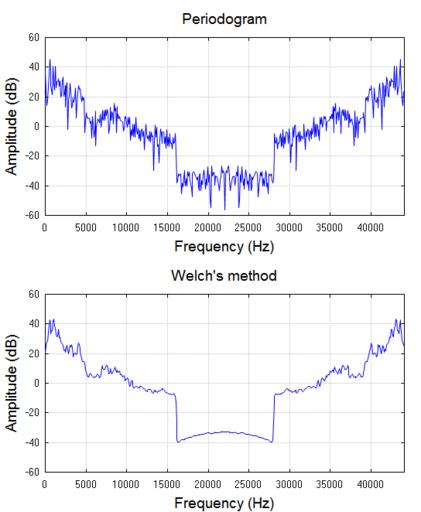
| Keywords: Comparison of periodogram and Welch methods of spectral density estimation.png en The power spectral density of a segment of music is estimated by two different methods for comparison 2016-10-24 own Bob K Octave script <source lang Matlab > pkg load signal graphics_toolkit gnuplot load 'music mat' adds variables wavedata and samplerate to the workspace whos displays the workspace music mat was created by these steps in program Audacity ¢ Open a stereo mp3 file ¢ Right-click on the filename and choose Split Stereo to Mono in the drop-down menu ¢ Delete one channel ¢ Highlight a section to be exported ¢ Choose Export Selected Audio ¢ Choose Save As Type Other Uncompressed Files ¢ Under Options set Header MAT5 and Encoding Signed 16-bit PCM periodogram wavedata 512 samplerate 'twosided' grid on xlim 0 samplerate title Periodogram 'FontSize' 14 xlabel 'Frequency Hz ' 'FontSize' 14 ylabel 'Amplitude dB ' 'FontSize' 14 figure pwelch wavedata hann 512 0 25 512 samplerate 'twosided' 'dB' grid on xlim 0 samplerate ylim -60 60 title Welch's method 'FontSize' 14 xlabel 'Frequency Hz ' 'FontSize' 14 ylabel 'Amplitude dB ' 'FontSize' 14 </source> cc-zero Digital signal processing Spectral power distribution | ||||